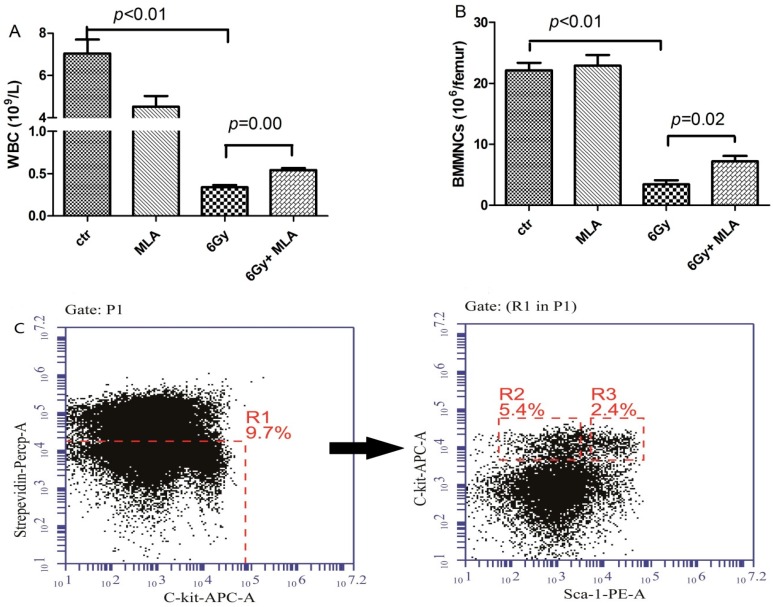
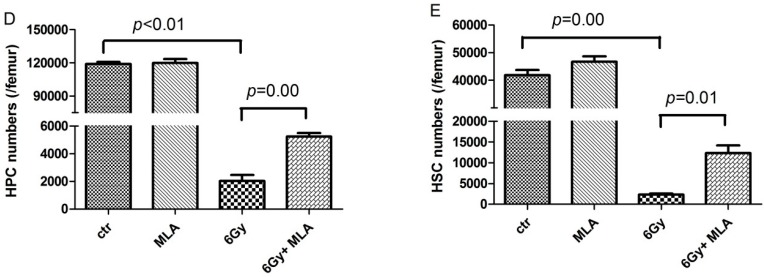
Figure 3.
The effects of MLA on the numbers of BMMBNCs, HPCs, and HSCs. (A) Number of WBCs; (B) number of BMMNCs; (C) a representative flow cytometry graph: The BMMNCs were firstly gated by Strepevidin–Percp and C-kit-APC, and the HPC (lin− c-kit+ Sca-1−,R2) and HSC (lin− c-kit+ Sca-1+,R3) cells were then analyzed in the lineage negative cells (Strepevidin−, R1); (D) number of HPCs; E) number of HSCs. Before the mice were exposed to 6 Gy TBI, they were treated with either vehicle or MLA (10 mg/kg) each day three times. Sham-irradiated control mice and MLA-treated mice were also included. WBCs and BMMNCs were collected and counted after the mice were euthanized nine days after exposure to 6 Gy TBI. The numbers of HPCs (D) and HSCs (E) were calculated using the following formula: BMMNCs per femur multiply the HPC or HSC ratio detected by flow cytometry. Data are expressed as the mean ± SEM (n = 5 for each group). The p value shows the difference compared with the IR group.


