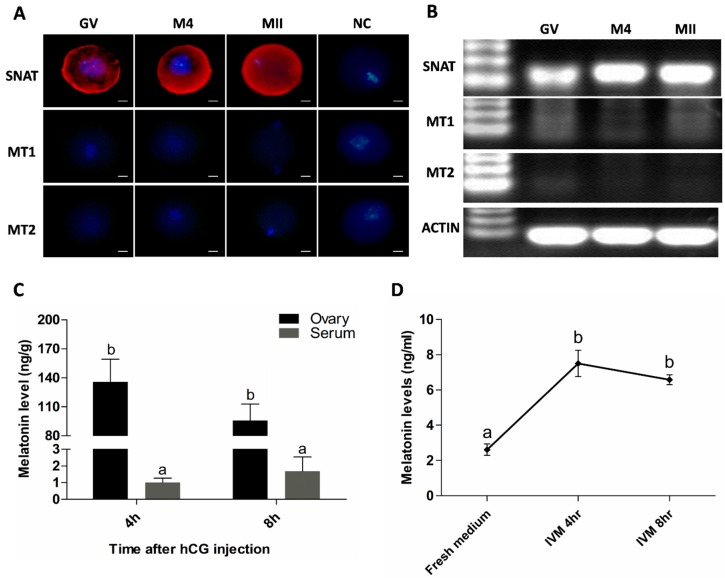
Figure 1.
Oocyte synthesis melatonin during its maturation. (A) Assayed with immunofluorescence. Red was SNAT staining. Scale bar = 20 μm; (B) Assayed with RT-PCR. GV: Germinal Vesicle Stage, M4: 4 h after hCG injection, MII; Metaphase II of Meiosis, NC: Negative Control; (C) Melatonin levels in ovary homogenate and serum of the animals after hCG injection (mean ± SEM); (D) Melatonin levels in IVM medium during oocyte culture (mean ± SEM); the different superscript letters (a–b) represent a significant difference (p < 0.05).

