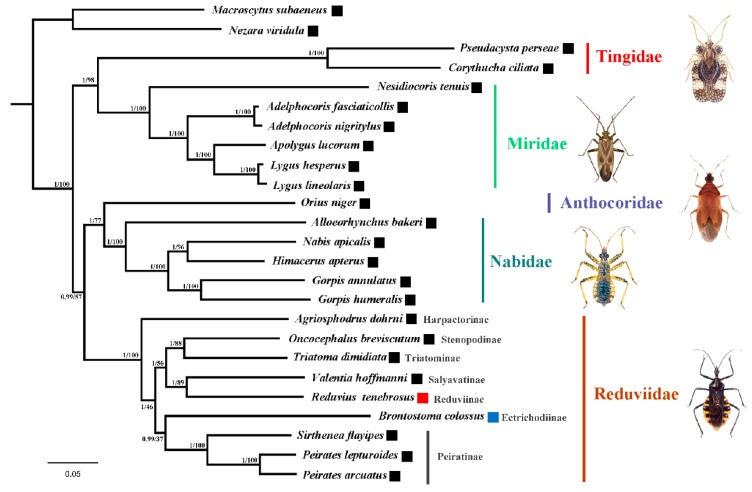
Figure 7.
The phylogenetic relationships among the seven reduviid subfamilies and five cimicomorphan families inferred from the mt genome sequences. Numbers close to the branching points are Bayesian posterior probabilities and maximum likelihood (ML) bootstrap support values. The black boxes refer to species without duplicated tRNAs. Red boxes indicate duplicate tRNA derived from the tRNA duplication/anticodon mutation model. Blue boxes represent duplicated tRNA caused by the tandem duplication/random loss model.

