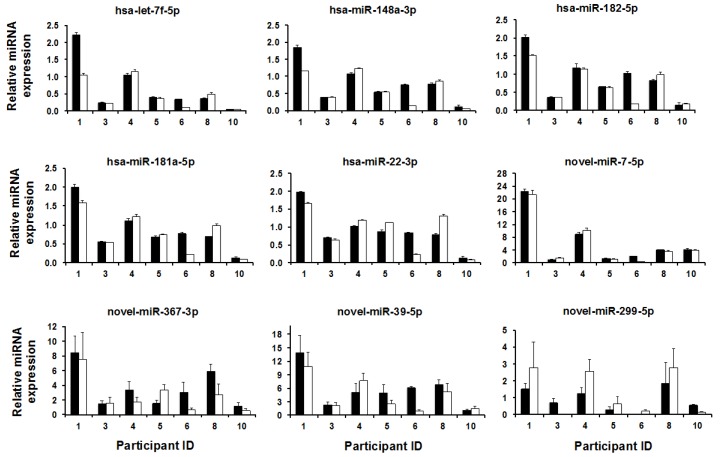
Figure 2.
Bar plots showing the expression pattern of the top 5 most highly expressed known miRNAs, and the top 4 most highly expressed novel miRNAs using qPCR. Y axes indicate the expression of each miRNA relative to the endogenous control used (RNU48), whilst X axes indicate Participant ID. A subgroup of 7 mothers was used for qPCR validation. Linear mixed effects modeling showed no significant differences (p > 0.05) in expression of these known and novel miRNAs between pre- and post-feed milk samples for each mother. novel-miR-299-5p was not detected in sample ID 6 (pre-feed milk) and in sample ID 3 (post-feed milk).

