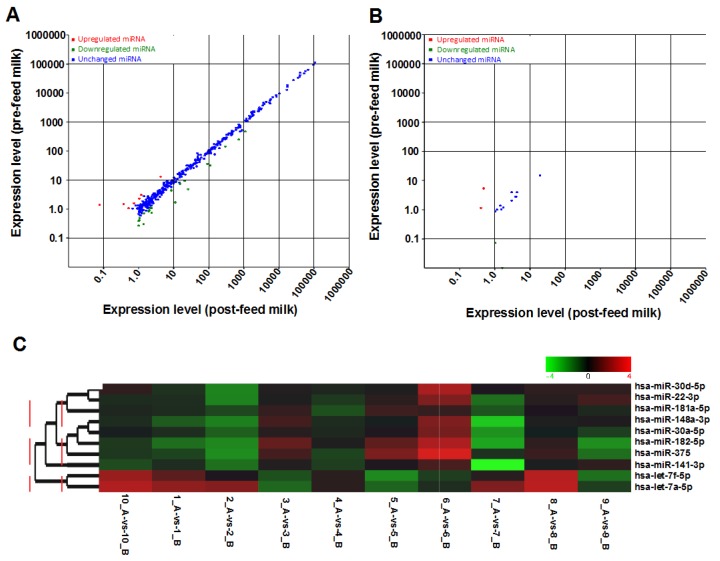
Figure 4.
The two differential expression scatter plots show all identified known (A) and novel (B) miRNAs that were expressed in all pre-and post-feed milk samples (n = 10 samples in each group). Each red and green dot represents an individual miRNA that is either up- or down-regulated between pre- and post-feed milk, respectively, whilst blue represents no difference in expression level; (C) Heat-map demonstrating the relationship and expression patterns of the top 10 most highly expressed miRNAs between pre-(B) and post-(A) feed milk of individual participants. The expression patterns were analyzed hierarchically by clustering these 10 miRNAs, where green refers to low expression and red refers to high expression level.

