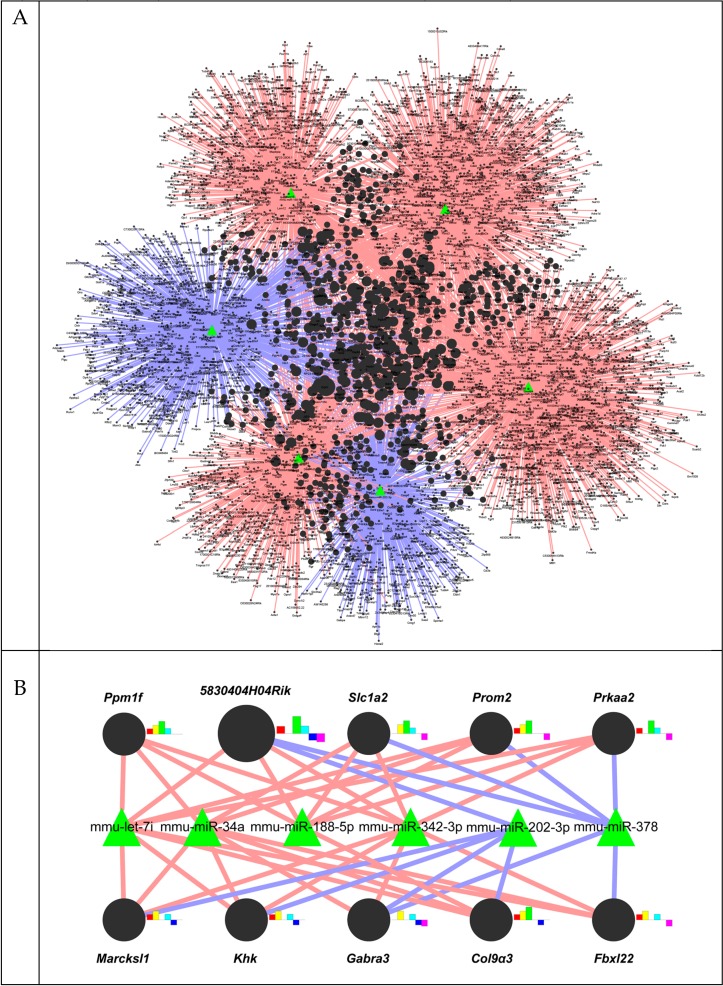
Figure 3.
The regulatory network of miRNAs and target genes. The interaction network between miRNAs and target genes was generated by the Cytoscape program. Green-triangle and black-circle nodes indicate six differentially-expressed miRNAs and 4079 target genes, respectively. Color variations of the edges are as follows: red, upregulated miRNAs; blue, downregulated miRNAs. The size of the circle nodes indicates the numbers of associated miRNAs. The smallest node represents genes associated with one miRNA, while the largest node represents genes associated with five miRNAs. (A) Total network; (B) top 10 core networks. Bar graphs on the right side of target genes show the log change of associated miRNAs in CCl4-treated livers (red: let-7i, yellow: miR-34a, green: miR-188-5p, sky blue: miR-342-3p, blue: miR-202-3p, pink: miR-378).

