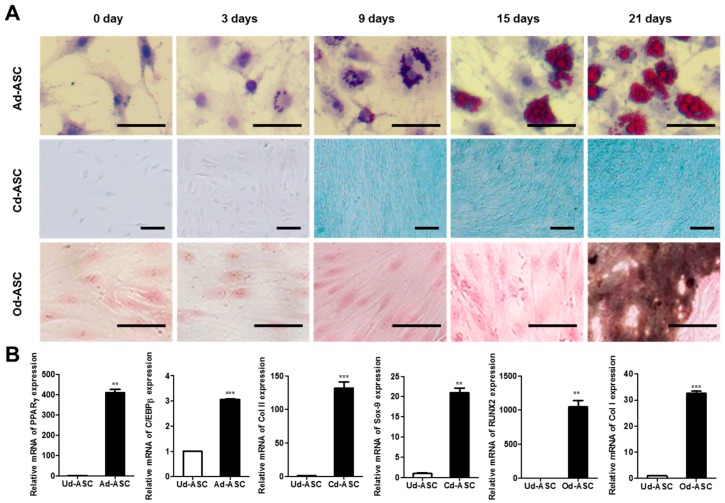
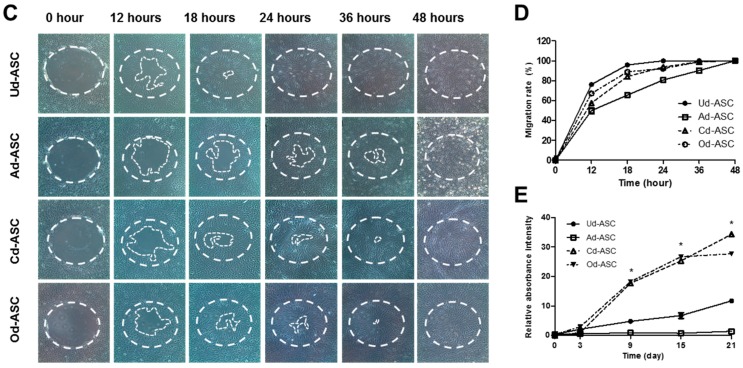
Figure 1.
Characterization of hASCs. (A) hASCs were incubated with adipogenic, chondrogenic, and osteogenic differentiation medium for 21 days. The efficiencies of differentiation were determined by histological staining as Oil Red O staining, Alcian Blue staining, and von Kossa staining, respectively (scale bar = 50 μm); (B) the mRNA expression of differentiation marker was measured by qPCR after 21 days of induction. The data are shown as the mean ± SEM (n = 3, **: p < 0. 005, ***: p < 0.0005); (C) the migration of Ud-ASC, Ad-ASC, Cd-ASC, and Od-ASC were investigated using Radius™ 24-Well Cell Migration Assay. The broken line circles indicate the rim of the cells prior to migration; (D) the quantitative data of the migration area was calculated by ImageJ software (n = 3); and (E) the proliferation of Ud-ASC, Ad-ASC, Cd-ASC, and Od-ASC was measured using CCK-8 kit. The data are shown as the mean ± SEM (n = 3, Ud-ASC vs. Cd-ASC, *: p < 0. 05).


