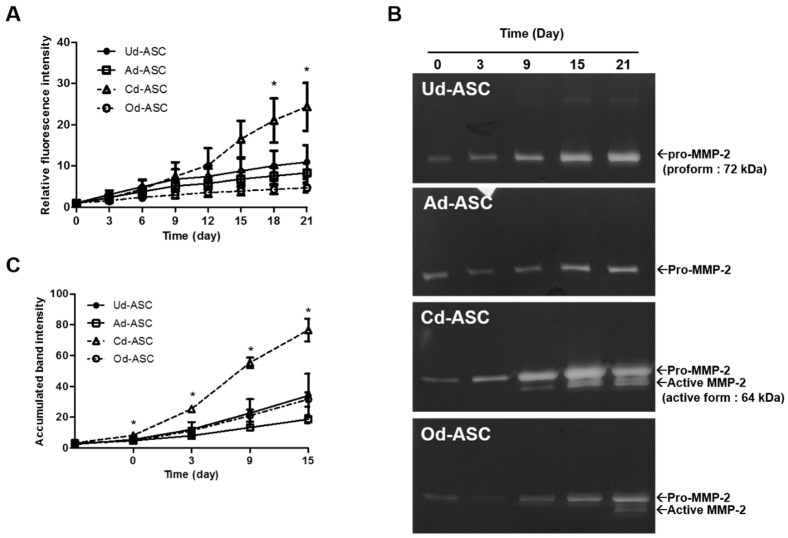
Figure 2.
Proteolytic enzyme activity in hASCs during differentiation. (A) The proteolytic enzyme activities of Ud-ASC, Ad-ASC, Cd-ASC, and Od-ASC were detected by DQ-BSA; (B) the MMP-2 activities of Ud-ASC, Ad-ASC, Cd-ASC, and Od-ASC were measured by zymography. The molecular weight of MMP-2 pro-form is 72 kDa and the active form is 62 kDa; and (C) the quantitative data of accumulated band intensity of MMP-2, both pro-form and active-form. The band intensity (in panel B) was measured by ImageJ software. The data are shown as the mean ± SEM (n = 3, Ud-ASC vs. Cd-ASC, *: p < 0.05).

