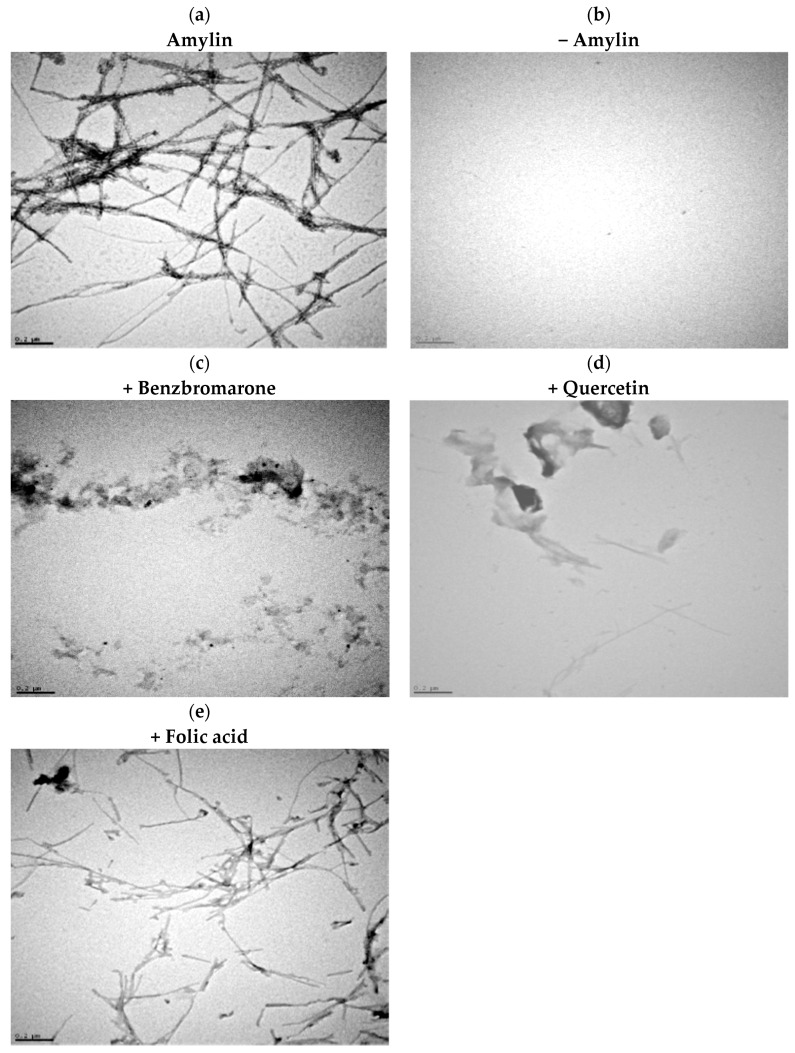
Figure 3.
Amylin aggregation inhibition visualized using transmission electron microscopy (TEM). Amylin (8–37) at 50 µM was incubated in the presence or absence of the compounds (at 100 µM), fibers were negatively stained and imaged using TEM. Positive control (amylin alone): panel (a); negative control (no amylin): panel (b); amylin in presence of benzbromarone, quercetin, and folic acid: panels (c, d, or e), respectively. The length of the scale bars is 0.2 µm. Compounds strongly inhibit amylin amyloid fibril formation.

