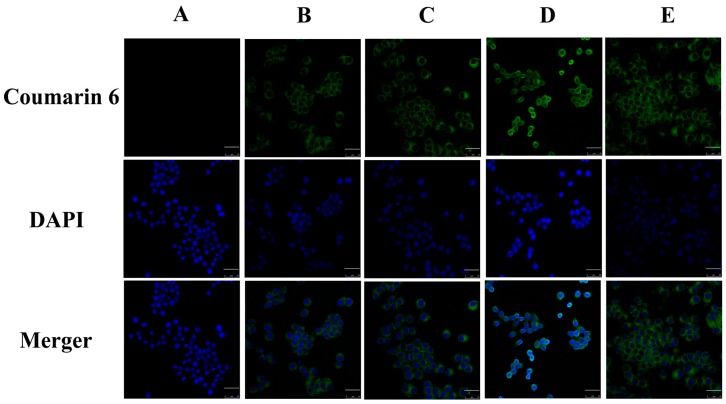
Figure 7.
CLSM images. (A) negative control group (blank culture medium without NLCs); (B) 0% PS containing C6-mNLCs; (C) 4% PS containing C6-mNLCs; (D) 8% PS containing C6-mNLCs; (E) 12% PS containing C6-mNLCs. The cellular uptake of C6-mNLCs was increased with an increasing amount of PS in the nanoparticles, up to 8% PS. Also, the uptake was decreased when PS concentrations reached 12%. Scale bar is 25 µm.

