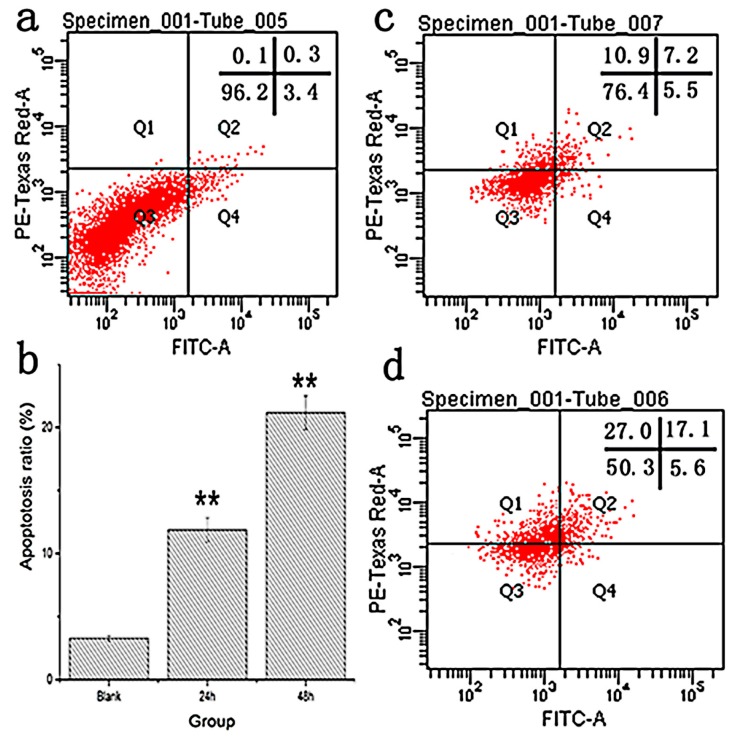
Figure 7.
M2-induced apoptosis in HT-29 cells: (a) natural apoptosis of HT-29 cells without M2 (Blank) at 48 h on flow cytometry; (c,d) apoptosis of M2-treated cells at 24 and 48 h, respectively, on flow cytometry; and (b) bar graph summarizes the percentage of apoptosis. Data are expressed as mean ± SD of six replicate. **: p < 0.01.

