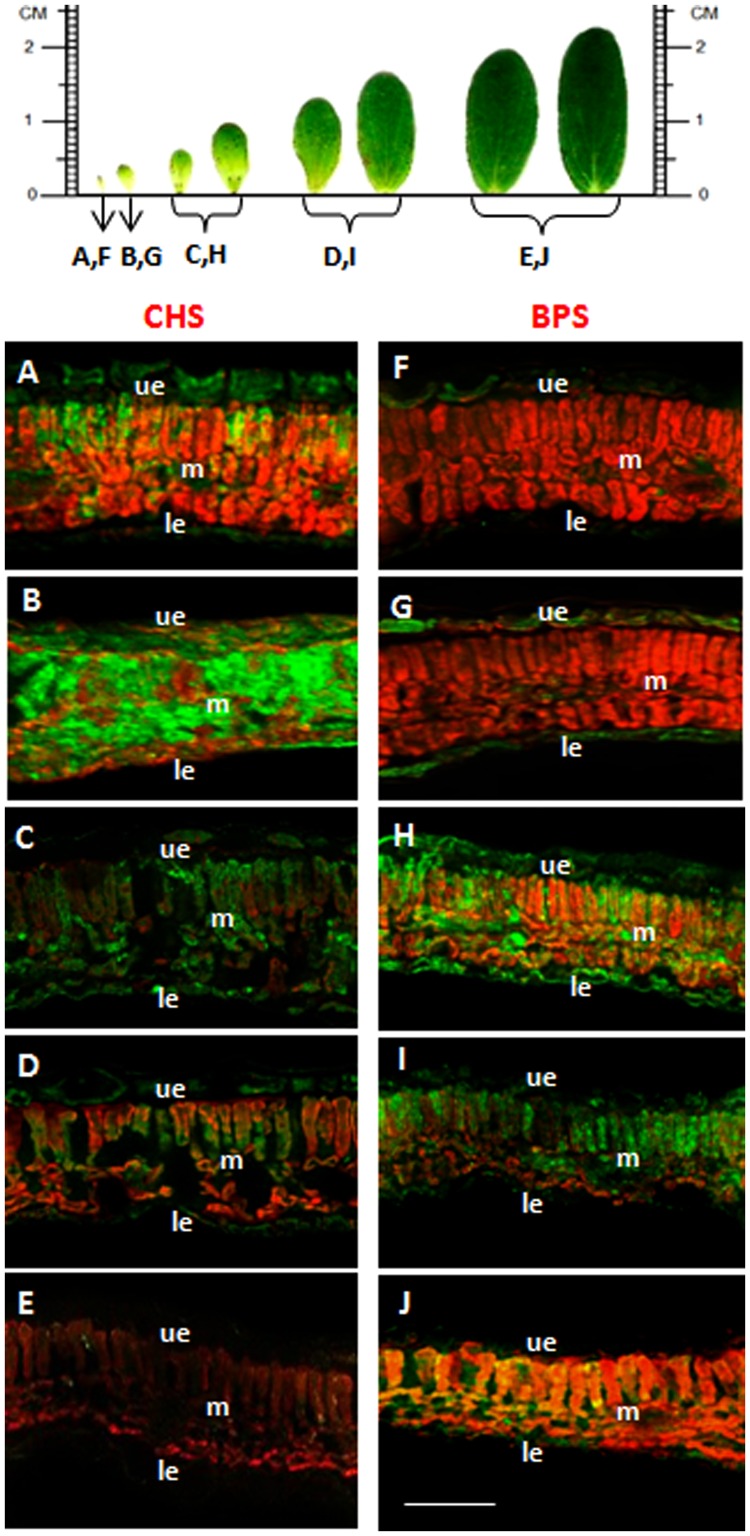
FIGURE 6.
The developmental stages of maximum BPS and CHS levels differ. CHS (A–E) and BPS (F–J) were immunolocalized using a green fluorescent dye. Sections were prepared from leaves with a blade length of approximately 0.3 cm (A,F), 0.5 cm (B,G), 0.8 cm (C,H), 1.5 cm (D,I) and 2.0 cm (E,J). ue, upper epidermis; le, lower epidermis; m, mesophyll. Bar, 100 μm.

