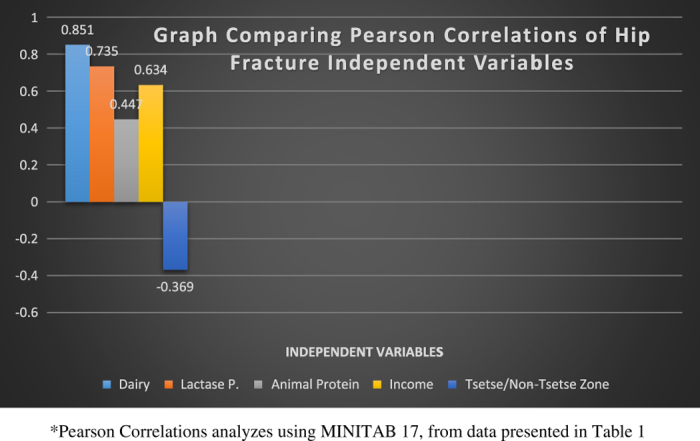
Figure 6.

A graph depicting the degree of correlation between Hip Fracture Rates per 100 000 and 5 independent variables: dairy consumption, lactase persistence, animal protein consumption, per capita income and habitation in tsetse or non-tsetse zones.
