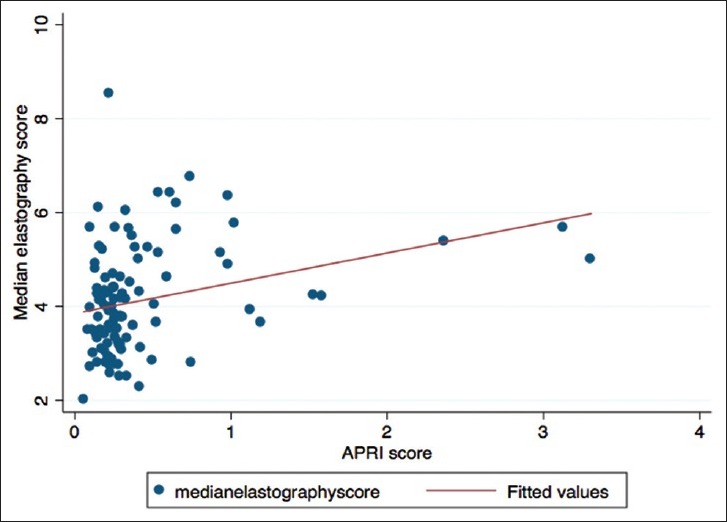
Figure 6.

A scatter plot between median elastography scores and aspartate aminotransferase-to-platelet ratio index scores with a fitted linear regression line. There was a better correlation between the two for patients with aspartate aminotransferase-to-platelet ratio index score less than 0.5 as opposed to those with higher scores.
