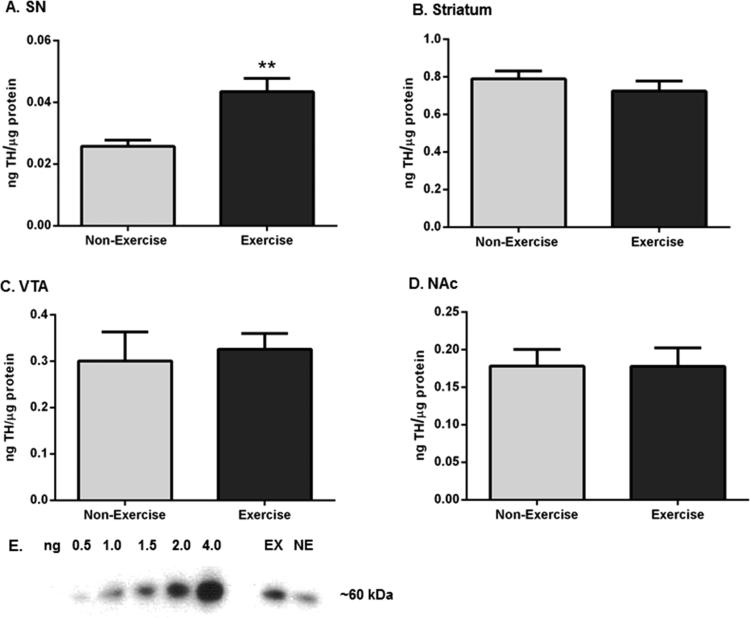
Figure 4.
TH protein expression in the nigrostriatal and mesoaccumbens pathways following exercise. Results are expressed as nanograms of TH per microgram of protein and were analyzed by a two-tailed unpaired t-test to compare differences in TH protein expression between the two groups after exercise. Data are presented as mean ± SEM. (A) SN. There was a significant increase in TH protein expression following exercise (n = 8 (non-exercise), n = 7 (exercise), t = 3.851, **p < 0.01). (B) Striatum. TH protein expression was not significantly different after exercise (n = 7 (non-exercise), n = 8 (exercise), t = 0.926, p = 0.37). (C) VTA. There was no significant difference in TH protein expression after exercise (n = 8 per group, t = 0.353, p = 0.73). (D) NAc. TH protein expression was not significantly different between the groups following exercise (n = 8 per group, t = 0.016, p = 0.99). (E) Representative western blot of immunoreactivity against TH. A representative western blot depicting a TH standard curve and the effect of exercise upon TH immunoreactivity in the SN of one exercise and one non-exercise rat. A TH standard curve, ranging from 0.5 to 4.0 ng, was run in combination with all samples from the four brain regions.

