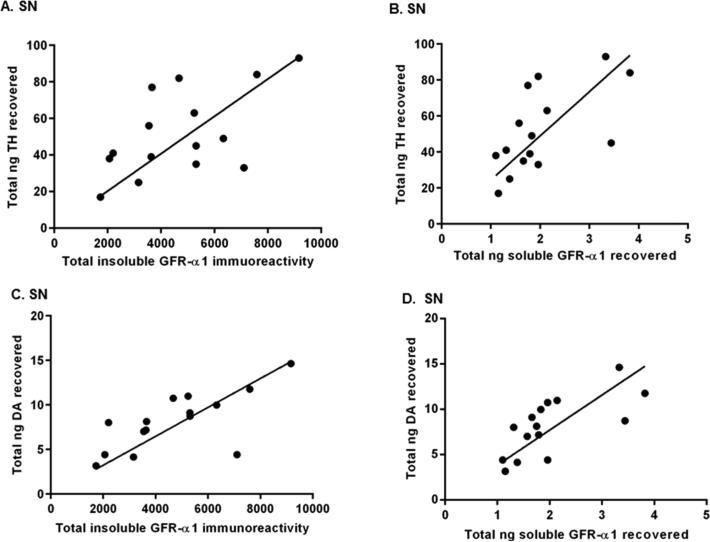
Figure 6.
Relationship of GFR-α1 expression to TH protein and DA tissue content in the SN following exercise. A Pearson correlational analysis determined if there were relationships of total insoluble GFR-α1 immunoreactivity (insoluble GFR-α1 immunoreactivity per microgram of protein assayed for each sample multiplied by total micrograms protein recovered in the sample) or total nanograms of soluble GFR-α1 recovered (nanograms of soluble GFR-α1 per microgram of protein assayed for each sample multiplied by total micrograms of protein recovered in the sample) to both total nanograms of TH recovered (nanograms of TH per microgram of protein assayed for each sample multiplied by total micrograms of protein recovered in the sample) and nanograms of DA recovered (nanograms of DA per microgram of protein assayed for each sample multiplied by total micrograms of protein recovered in the sample) in the SN (n = 8 (non-exercise), n = 7 (exercise)). (A) Correlation of insoluble GFR-α1 and TH in SN. There was a significant correlation between total insoluble GFR-α1 immunoreactivity and total nanograms of TH recovered (n = 15, Pearson r = 0.58, *p < 0.05). (B) Correlation of soluble GFR-α1 and TH in SN. Total nanograms of soluble GFR-α1 recovered and total nanograms of TH recovered were significantly correlated (n = 15, Pearson r = 0.63, *p < 0.05). (C) Correlation of insoluble GFR-α1 and DA in SN. There was a significant correlation between total insoluble GFR-α1 immunoreactivity and total nanograms of DA recovered (n = 15, Pearson r = 0.71, **p < 0.01). (D) Correlation of soluble GFR-α1 and DA in SN. There was a significant correlation between total nanograms of soluble GFR-α1 recovered and total nanograms of DA recovered (n = 15, Pearson r = 0.70, **p < 0.01).

