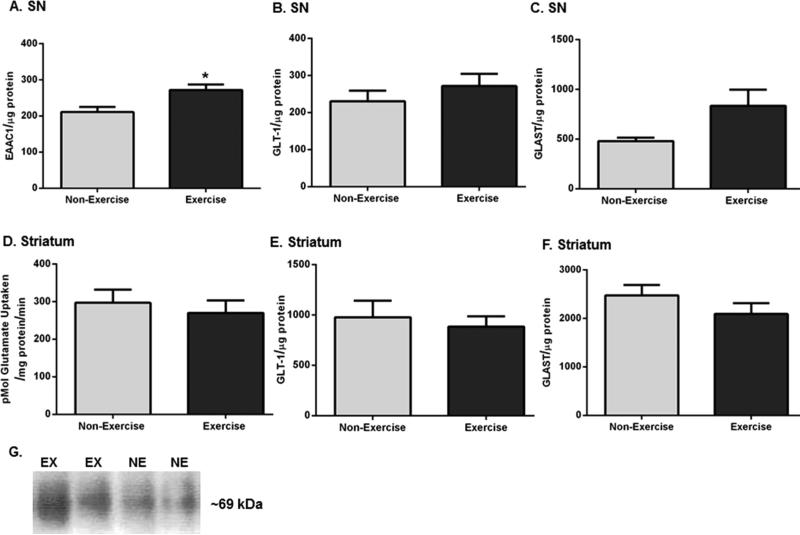
Figure 8.
Nigrostriatal glutamate transporter expression and striatal glutamate uptake following exercise. Results are expressed as EAAC1 per microgram of protein, GLT-1 per microgram of protein, GLAST per microgram of protein, or picomoles of glutamate uptaken per milligram of protein per minute, and a two-tailed paired t-test was used to determine relative differences in striatal glutamate uptake, whereas an unpaired two-tailed t-test was used to determine differences in glutamate transporter expression between the two groups. Data are presented as mean ± SEM. (A) EAAC1 in SN. There was a significant increase in EAAC1 expression after exercise (n = 8 (non-exercise), n = 7 (exercise), t = 2.933, *p < 0.05). (B) GLT-1 in SN. There was no significant difference in GLT-1 expression between the groups after exercise (n = 8 per group, t = 0.942, p = 0.36). (C) GLAST in SN. There was a trend toward a significant increase in GLAST expression in exercise rats compared to that in non-exercise rats (n = 8 per group, t = 2.142, p = 0.050). (D) Glutamate uptake in striatum. There was no significant difference in glutamate uptake between the groups after exercise (n = 6 per group, t = 0.731, p = 0.50). (E) GLT-1 in striatum. There was no significant difference in GLT-1 expression after exercise (n = 8 per group, t = 0.475, p = 0.64). (F) GLAST in striatum. There was no significant difference in GLAST expression between the two groups (n = 8 per group, t = 1.247, p = 0.23). (G) Representative western blot for immunoreactivity against EAAC1. A representative blot showing the effect of exercise upon EAAC1 immunoreactivity in the SN of one exercise and one non-exercise rat.

