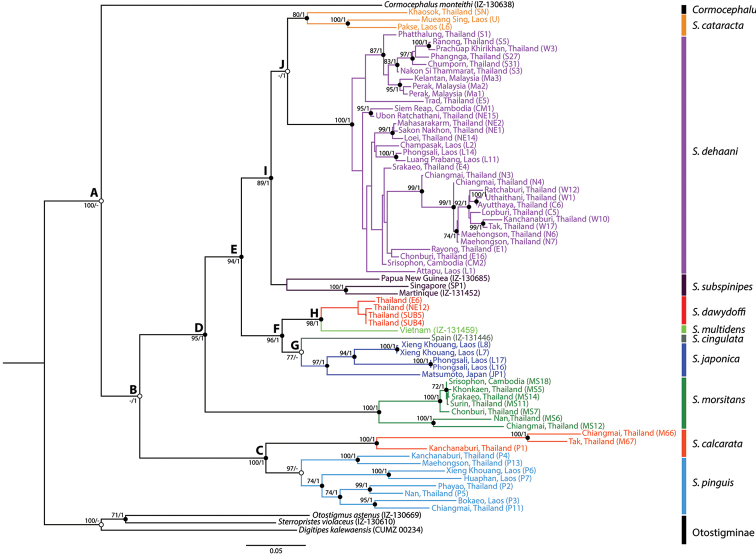
Figure 1.
Maximum likelihood tree for Scolopendra in mainland Southeast Asia: colours for clades correspond to species and outgroups; black and white circles indicate statistical support values in both ML and BI analyses or only ML or BI analysis, respectively. Numbers at nodes are bootstrap support and posterior probability. Specimen codes in parentheses following localities correspond to Siriwut et al. (2015a, b: table 2) and Vahtera et al. (2013: table 1).

