Figure 4.

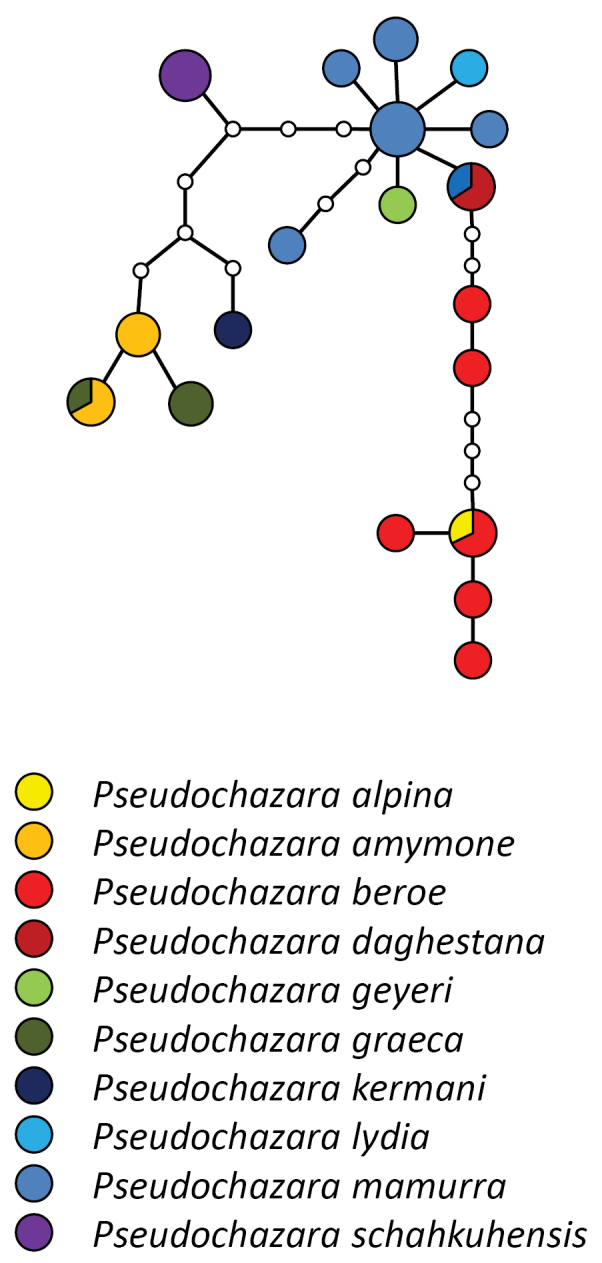
Statistical Parsimony network of the ‘mamurra’ species group. Coloured circles represent COI haplotypes and their size corresponds to the number of samples per haplotype. Small white circles represent unsampled haplotypes.

Statistical Parsimony network of the ‘mamurra’ species group. Coloured circles represent COI haplotypes and their size corresponds to the number of samples per haplotype. Small white circles represent unsampled haplotypes.