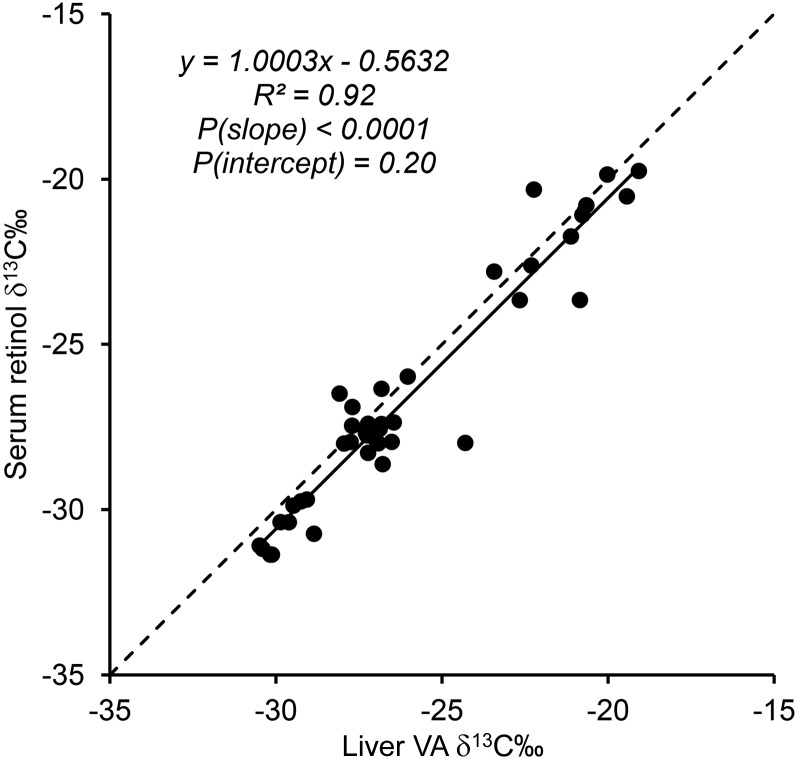
FIGURE 2.
Serum retinol δ13C‰ plotted against liver VA δ13C‰ for gerbils that consumed diets with varying amounts and sources of provitamin A carotenoids and preformed VA. Only gerbils with values for both outcomes are plotted (n = 40; 3–7/group) along with the best fit line of the data (solid line) and y = x (dashed line). VA, vitamin A.

