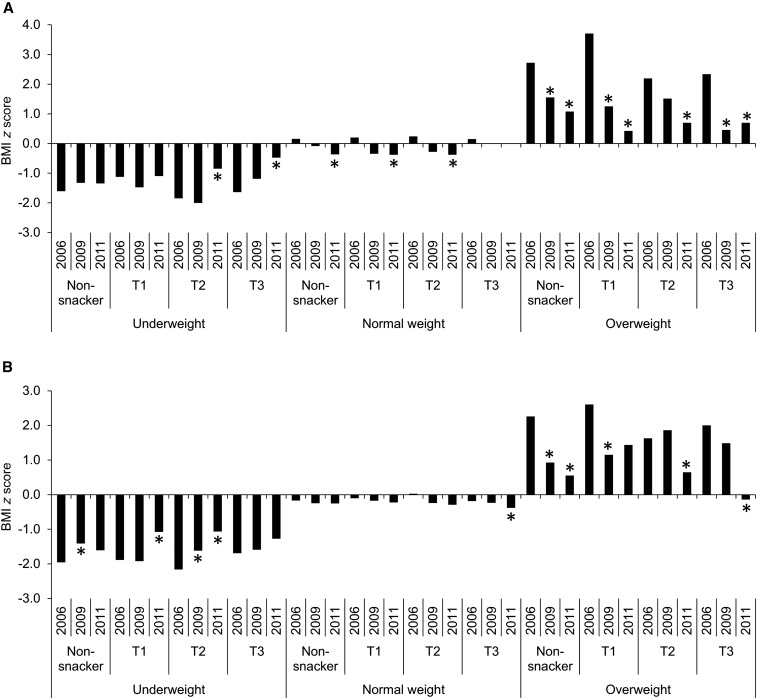
FIGURE 1.
Adjusted predicted mean BMI z score by baseline weight status and tertile of snacking, 2006–2011 for children aged 2–6 y at baseline (n = 427) (A) and children aged 7–13 y at baseline (n = 537) (B). Tertiles were based on absolute energy intake from snacks (kilocalories) within an age group. *Within snacking category and baseline weight status, mean BMI z score differed from 2006, P < 0.05, from mixed-effects models controlling for sex, urbanicity, income, maximum parental education, physical activity, and percentage of meal calories from foods consumed at meals (fruit, vegetables, oils, meat, and rice). T, tertile.

