Figure 5.
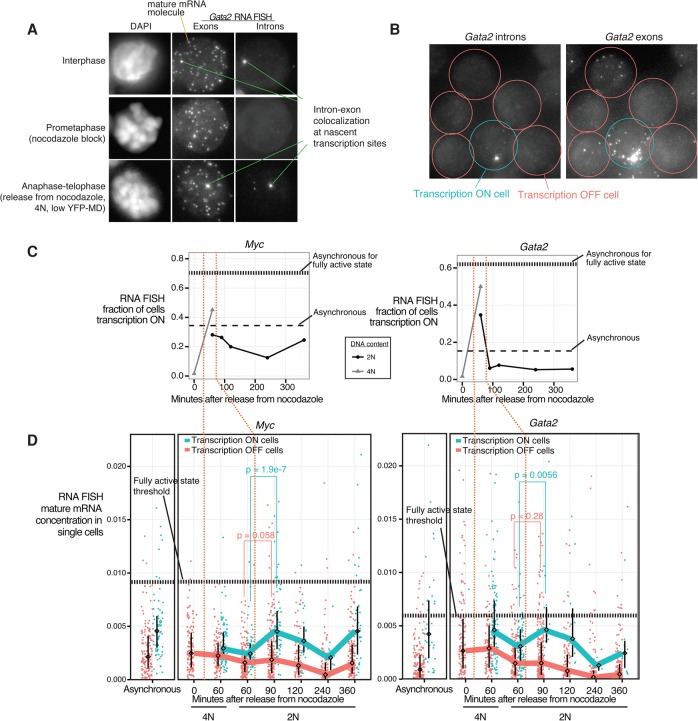
The mitosis–G1 transcriptional spike can propagate to cell-to-cell heterogeneity in mature mRNA expression. (A) Images of representative cells in interphase, in prometaphase arrest by nocodazole, and between anaphase and telophase (60 min after nocodazole release, sorted for 4N and YFP-MD low) taken by 3D wide-field microscopy. A single optical plane is shown for the DAPI channel. Maximum projections are shown for the Gata2 exonic probe (coupled to Cy3) and intronic probe (coupled to Alexa 594) channels for RNA FISH, with single mature mRNA molecules and intron–exon-colocalized spots highlighted. (B) Gata2 intron and exon RNA FISH in a representative field of asynchronous cells. (C) In cells subjected to nocodazole arrest–release and FACS-purified in a manner similar to Figure 1B, we performed RNA FISH for Myc and Gata2 in the low expression state (+estradiol 13 h) and quantified the fraction of cells that contain at least one intron–exon colocalized spot, indicative of active transcription (referred to here as transcriptionally “on”). Horizontal dashed lines indicate levels from asynchronous populations in both the low expression (+estradiol 13 h) and fully activated (no estradiol) states. (D) From the same experiment as in C, we show the distributions of single-cell mature mRNA concentrations (mRNA count/cell size) of transcriptionally “on” versus “off” cells, with each dot representing a cell. The line connects the medians of the distributions, and the interquartile range is indicated. We imaged 120–262 cells for each time point. Vertical orange dotted lines demarcate the timing of the transcriptional spike as shown in C. Horizontal dotted lines mark thresholds selected based on receiver operating characteristic curves (Supplemental Fig. S19) for discriminating the low expression (+estradiol 13 h) versus fully activated (no estradiol) asynchronous populations. Additional biological replicates are shown in Supplemental Figure S17. P-values (one-sided Wilcoxon test) for the differences in distributions between the transcription “on” and “off” cells are indicated for select time points.

