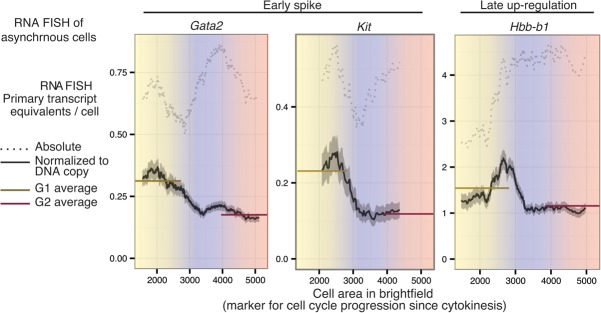
Figure 6.
The mitosis–G1 transcriptional spike can be observed in the absence of synchronization and can constitute the maximum transcriptional activity per DNA copy in the entire cell cycle. Asynchronously dividing cells were imaged by 3D wide-field microscopy after performing RNA FISH for two early spike genes (Gata2 and Kit) and a late-up-regulated gene (Hbb-b1) using intronic and exonic probes. Primary transcript content is shown in a dotted line in terms of absolute primary transcript equivalents per cell and in a solid line after normalization by DNA content as a moving mean across cell area manually determined from bright-field images. Using the proportionality between cell area and DAPI intensity (Supplemental Fig. S20), we roughly estimated the G1-, S-, and G2-phase boundaries demarcated by color. Solid horizontal lines indicate the average within the entire G1 or G2 compartment. Gata2 quantification is based on images of 5702 cells pooled across four biological replicates, Kit quantification is based on images of 640 cells, and Hbb-b1 quantification is based on images of 1339 cells. The gray shading around the moving mean denotes SEM within a sliding window of cell size.

