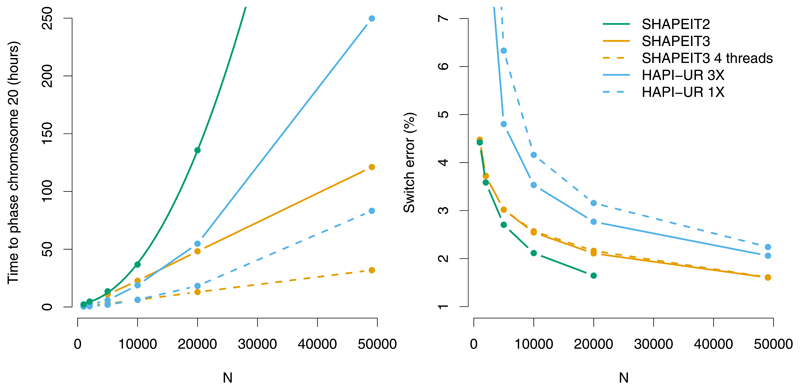
Figure 1. Performance on UK-BiLEVE chromosome 20 dataset.
Computation time (left) and switch error rate (right) of different phasing routines. Estimated haplotypes are compared to those derived from the IBD1 segments of the 384 likely sibling pairs. HAPI-UR 1X is the average switch error rate/time across three runs of HAPI-UR. HAPI-UR 3X performs majority voting of haplotypes across three runs (computation is the sum of three runs of HAPI-UR). SHAPEIT3 was run with cluster size M = 4,000, which substantially improves computational complexity, and hence running time compared to SHAPEIT2. Both SHAPEIT runs use K=100 conditioning states.

