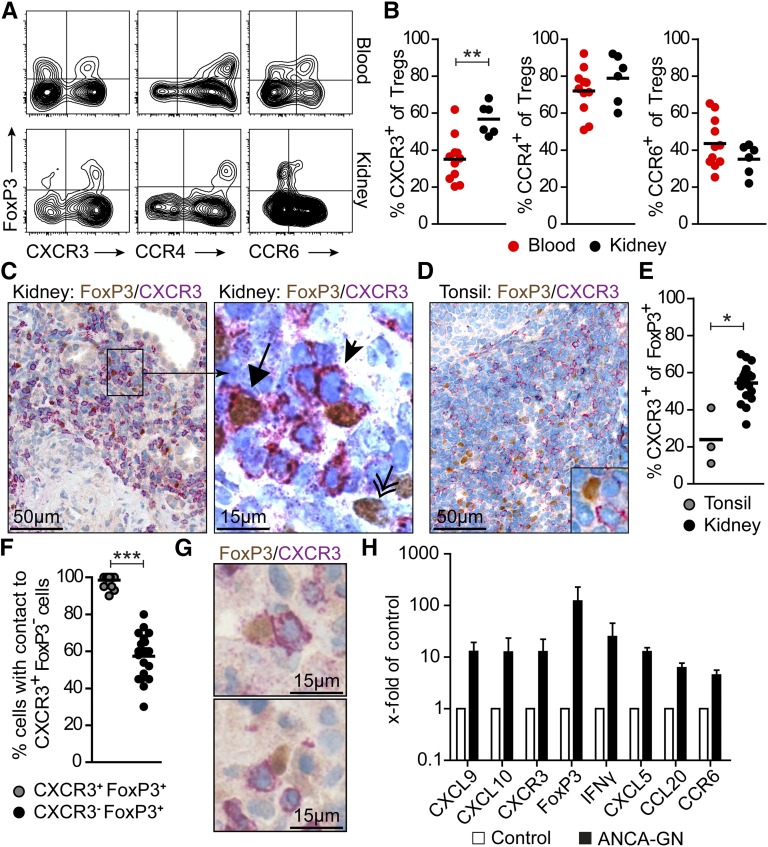
Figure 1.
Chemokine receptor expression on renal Tregs in patients with ANCA-associated GN. (A) Representative FACS plots and (B) quantification of chemokine receptor expression of CD4+ FoxP3+ Tregs from renal biopsies (n=6) and blood (n=11) from patients with ANCA-associated GN. (C) Immunohistochemical staining of serial sections for FoxP3 (brown) and CXCR3 (red) in human renal biopsies revealed the presence of CXCR3+ Tregs (arrow), CXCR3− Tregs (double arrow), and CXCR3+ effector cells (arrowhead). (D) Section of human tonsil stained for FoxP3 and CXCR3. (E) Relative quantification of CXCR3 expression on Tregs in tonsillar specimens (n=3) and renal biopsies (n=18). (F) Quantification and (G) representative immunohistochemical staining of FoxP3+ CXCR3+ and FoxP3+ CXCR3− Tregs with direct cell-cell contact to FoxP3−CXCR3+ T cells. (H) RT-PCR analyses of renal biopsies from patients with ANCA GN (n=11–12) and controls (n=11–13) normalized to 18S RNA. mRNA levels are expressed as x-fold of controls. Symbols represent individual data points, and lines and bars represent means±SEMs. Original magnification, ×200 in C, left panel and D; ×400 in C, right panel and G. *P<0.05; **P<0.01; ***P<0.001.

