Figure 4.
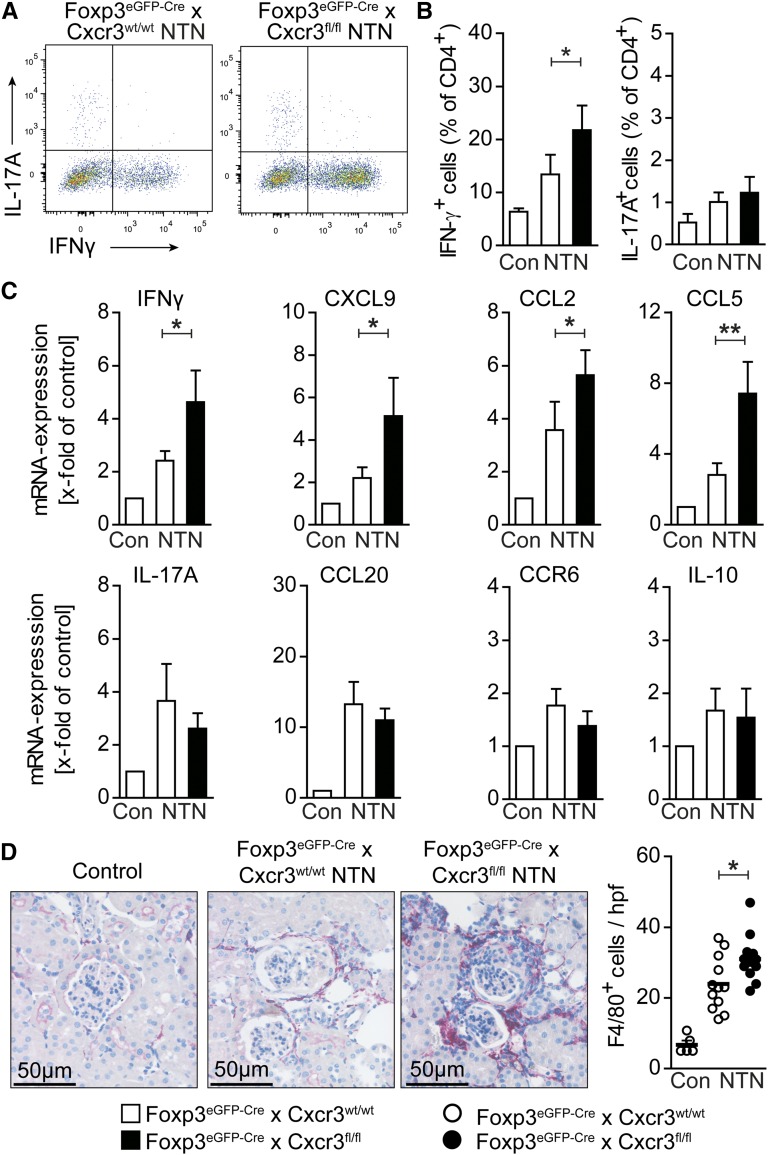
CXCR3+ Tregs control renal TH1 responses. (A) Representative FACS analysis and (B) quantification of renal IFNγ+ and IL-17A+ CD4+ T cells from control (n=4), nephritic Foxp3eGFP-Cre × Cxcr3wt/wt (n=10), and nephritic Foxp3eGFP-Cre × Cxcr3fl/fl (n=10) mice at day 30 of nephritis. (C) RT-PCR analysis of renal cortices at day 30 (n=10–12 per group). (D) Representative immunohistochemical photographs and quantification of renal F4/80+ mononuclear phagocyte infiltration at day 30 (n=10–12 per group). Symbols represent individual data points, lines and bars represent means. Original magnification, ×200. Con, control. *P<0.05; **P<0.01.

