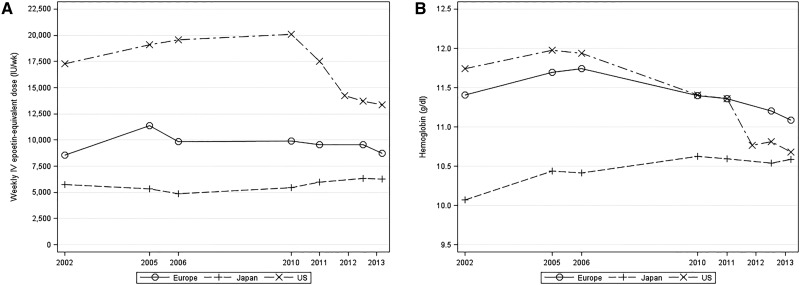
Figure 1.
Temporal trends (2002–2013) in prescribed ESA dose and Hb level among patients managed with ESAs by region. (A) Prescribed ESA dose and (B) Hb level among patients managed with ESAs by region. Values were reported at seven indicated time points using data from the DOPPS 2 (2002), the DOPPS 3 (2005 and 2006), the DOPPS 4 (2010 and 2011), and the DOPPS 5 (2012 and 2013).

