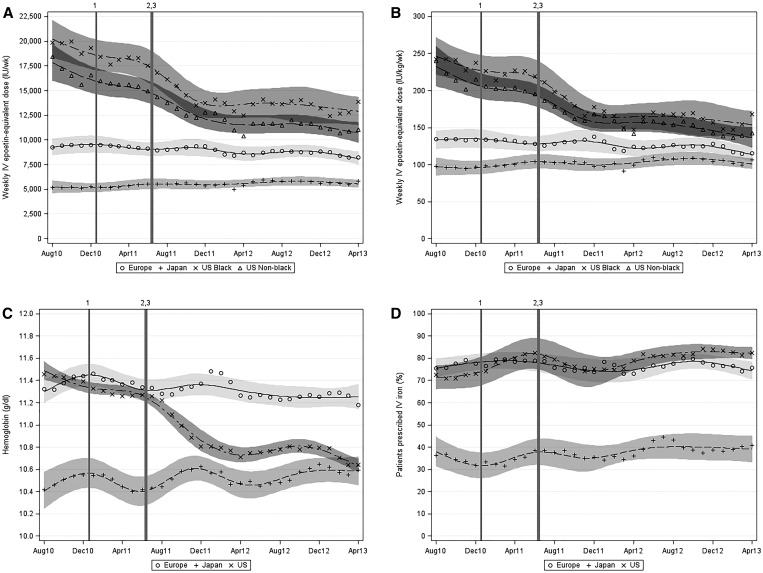
Figure 2.
Temporal trends (by region and month [August 2010 to April 2013]) in weekly prescribed ESA dose, weekly prescribed ESA dose per kilogram, Hb level among ESA-treated patients, and proportion of patients prescribed iv iron. (A) Weekly prescribed ESA dose, (B) weekly prescribed ESA dose per kilogram, (C) Hb level among ESA-treated patients, and (D) proportion of patients prescribed iv iron. Markers indicate monthly observed means. Regional trend lines were estimated using a restricted cubic spline model with seven knots. Vertical lines indicate significant changes to United States dialysis reimbursement policy or regulatory updates. PPS indicates the January of 2011 New Medicare ESRD PPS. QIP indicates the Medicare ESRD QIP program proposed rule removing Hb<10 g/dl as a measure. ESA dose conversions: subcutaneous epoetin, ×1.15; darbepoetin (iv or subcutaneous), ×250 units/μg; and pegylated epoetin-β (iv or subcutaneous), ×208 units/μg. 1Introduction of the revised PPS in January of 2011. 2ESA label revision in June of 2011. 3ESRD QIP proposed rule in July of 2011.

