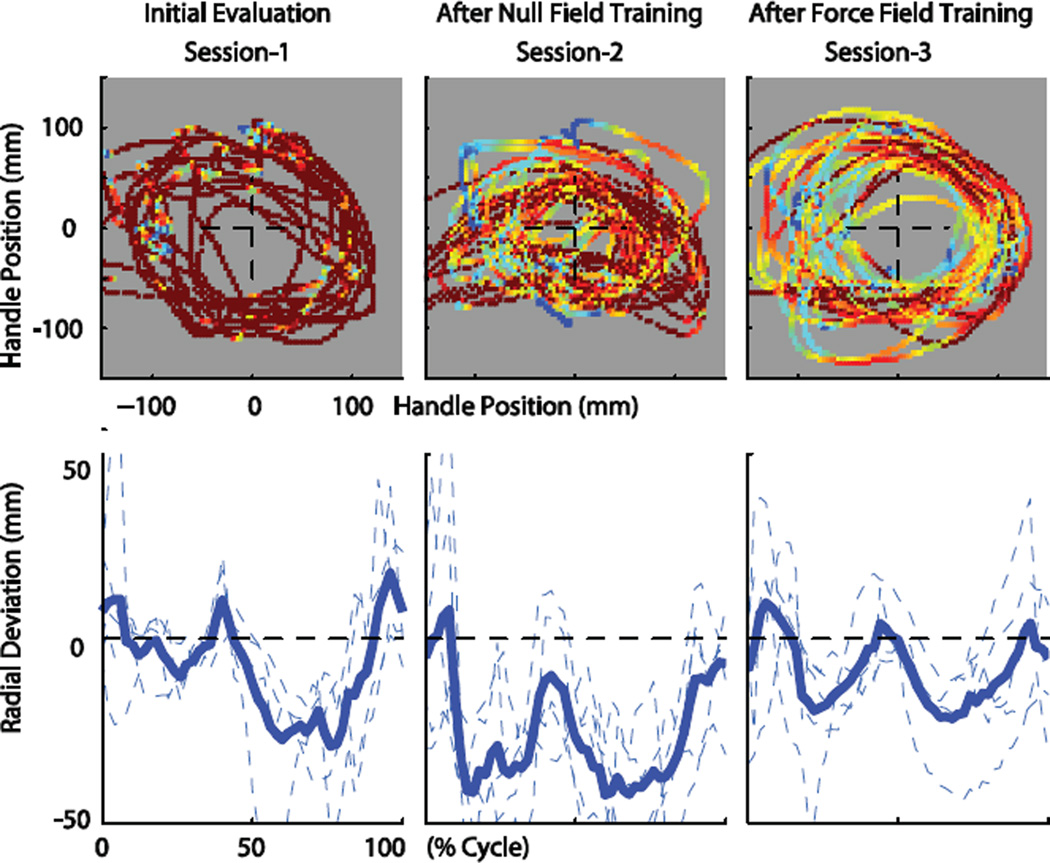
Fig. 2.
Trajectories of the initial evaluation (4 sample trials) show typical improvement over the course of three sessions (typical NVC subject. Color gradation (upper plots) indicates variations between highest to lowest speeds observed (red to blue). Mean radial deviation (blue line, lower plots) indicate reduction of systematic error.

