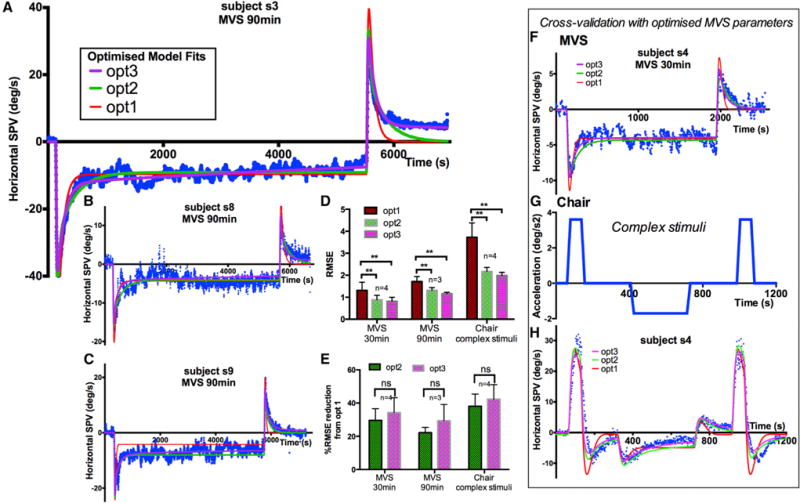
Figure 4. Model Fits to MVS and Chair Rotations.

(A–C) 90-min stimulation, subjects 3, 8, and 9. Optimized two-adaptation model (green) and three-adaptation model (purple) better fit the MVS data than a one-adaptation model (red).
(D) Goodness-of-fit comparisons between optimized models for 30 and 90 min of MVS and chair rotation. Statistical significance of p < 0.01 between all comparisons indicated by **.
(E) Improvement of goodness of fit with multiple adaptation models compared to single adaptation model. Qualitatively, the three-adaptation model (purple) best fits the graphs.
(F–H) Cross-validation using MVS parameters with data from complex chair rotations for subject 4. The parameters of simulations for individual subjects are shown in Table S1.
RMSE, root-mean-square-error.
