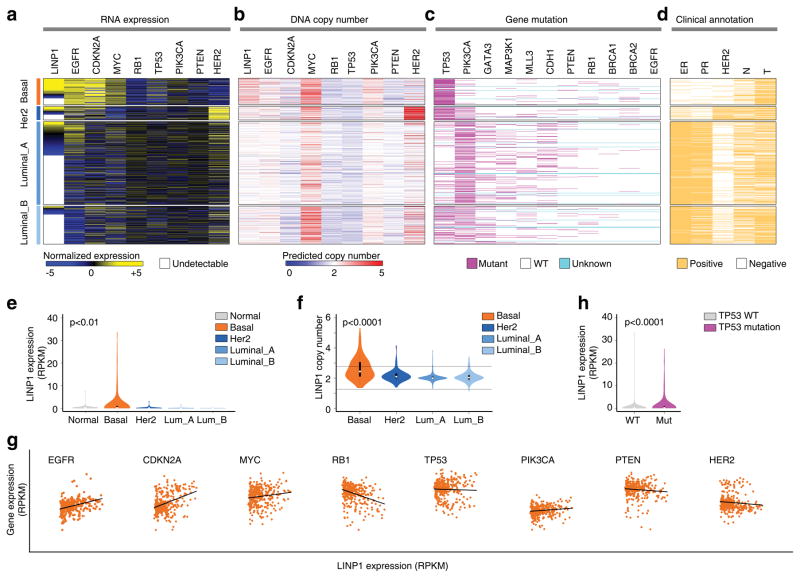
Figure 2. Expression and genomic alteration of LINP1 in breast cancer.
(a to d) Heat maps of the RNA expression (a) somatic gene copy number alterations (b) and mutation status (c) of LINP1 and key molecular alterations of breast cancer and the clinical annotation (d) in breast cancer samples. The genomic information was retrieved from the TCGA and was visualized by MeV: Multi-Experiment Viewer. The samples were grouped by their molecular subtypes in rows and ranked by LINP1 RNA expression level in each subtype. The genomic alteration of other genes and clinical profile were mapped in columns. (e) Violin plot showing LINP1 expression in different breast cancer subtypes. Two-tailed Student’s t-test; p-value<0.01. (f) Violin plot showing LINP1 gene copy number alterations in different breast cancer subtypes. Two-tailed Student’s t-test; p-value<0.0001. (g) Correlation between LINP1 expression and expression of EGFR, CDKN2A, MYC, RB1, TP53, PIK3CA, PTEN and HER2 in the breast cancer samples. (h) Violin plot showing LINP1 expression in breast cancer with wild-type or mutant TP53. Two-tailed Student’s t-test; p-value<0.0001.

