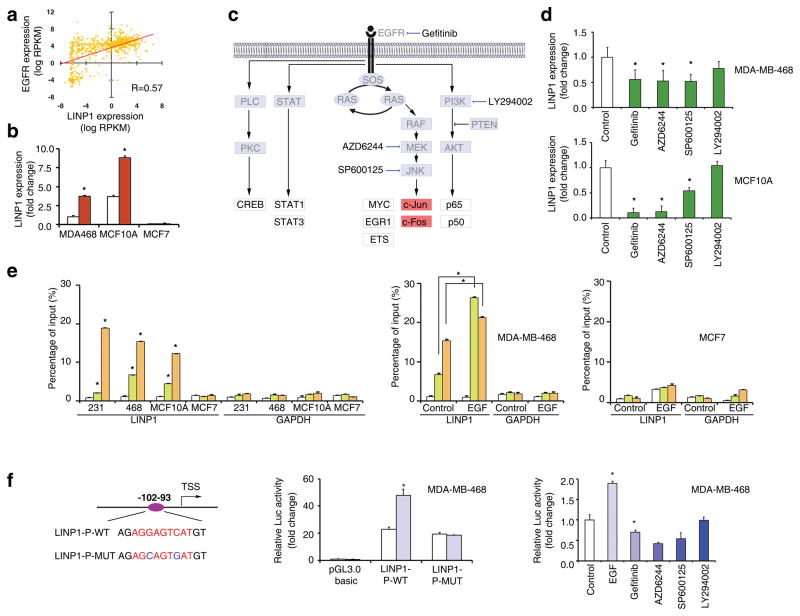
Figure 5. LINP1 is activated by the EGF signaling pathway.
(a) Correlation between LINP1 and EGFR expression in CCLE. Expression levels were determined by the RPKM from RNA-seq. R-value was calculated by Pearson test. (b) Expression of LINP1 in MDA-MB-468, MCF10A, and MCF7 cells treated with EGF or control. Error bars indicate SD; two-tailed Student’s t-test; * indicates p-value<0.05; n=3 independent technical replicates. (c) A schematic diagram of EGFR signaling. Small molecule inhibitors of EGFR signaling and their specific targets are indicated. (d) Expression of LINP1 in MDA-MB-468 and MCF10A cells treated with different small molecules that inhibit different parts of the EGFR pathway. RNA expression was analyzed by qRT-PCR. Error bars indicate SD; two-tailed Student’s t-test; * indicates p-value<0.05; n=3 independent technical replicates. (e) Left panel: Quantification of the amount of LINP1 promoter bound to c-Jun or c-Fos in MDA-MB-468, MCF10A, and MCF7 cells. The promoters were pulled down by c-Jun or c-Fos antibodies and measured by qPCR analysis. GAPDH was used as a negative control; Middle and Right panels: Quantification of the amount of LINP1 promoter bound to c-Jun or c-Fos in MDA-MB-468 (middle) and MCF7 (right) cells which were treated with EGF. Error bars indicate SD; two-tailed Student’s t-test; * indicates p-value<0.05; n=3 independent technical replicates. (f) Left panel: An illustration of an AP1 binding site at −102 (red indicates the consensus motif) and the sequences of the AP1 mutations (blue indicates the mutant nucleotides); Middle panel: Luciferase reporter assay of the promoter activities of the LINP1 core promoter construct and its AP1 mutant counterpart in MDA-MB-468 cells treated with EGF; Right panel: Luciferase reporter assay assessing the promoter activities of the LINP1 core promoter construct in MDA-MB-468 cells with different small molecules that inhibit different parts of the EGFR pathway. Error bars indicate SD; two-tailed Student’s t-test; * indicates p-value<0.05; n=3 independent technical replicates.

