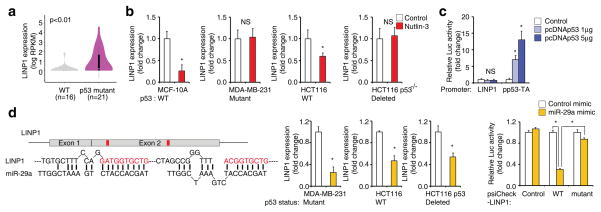
Figure 6. LINP1 is repressed by the p53 signaling pathway.
(a) LINP1 expression in the CCLE breast cancer cell lines in which the TP53 mutation status is known. Two-tailed Student’s t-test; p-value<0.01. (b) LINP1 expression in cells of different TP53 status, in response to nutlin-3a treatment. MCF10A and HCT116, TP53 WT cells; MDA-MB-231, TP53 mutant; HCT116 with TP53 deletion, TP53 null. Error bars indicate SD; two-tailed Student’s t-test; * indicates p-value<0.05; n=3 independent technical replicates. (c). Luciferase assay measuring the transcription activity of LINP1 and construct containing a known p53 binding site in cells expressing control vector or WT TP53. Error bars indicate SD; two-tailed Student’s t-test; * indicates p-value<0.05; n=3 independent cell cultures. (d) Left panel: Sequence alignment showing the complementarity between LINP1 exon 2 and miR-29. Red: seed sequence of miR-29; Middle panel, LINP1 expression in cells of different TP53 status after treated with vehicle or miR-29; Right panel: Luciferase assay measuring the activity of WT or mutant LINP1-luciferase fusion reporter constructs in response to treatment with miR-29 mimic. Error bars indicate SD; two-tailed Student’s t-test; * indicates p-value<0.05; n=3 independent cell cultures.

