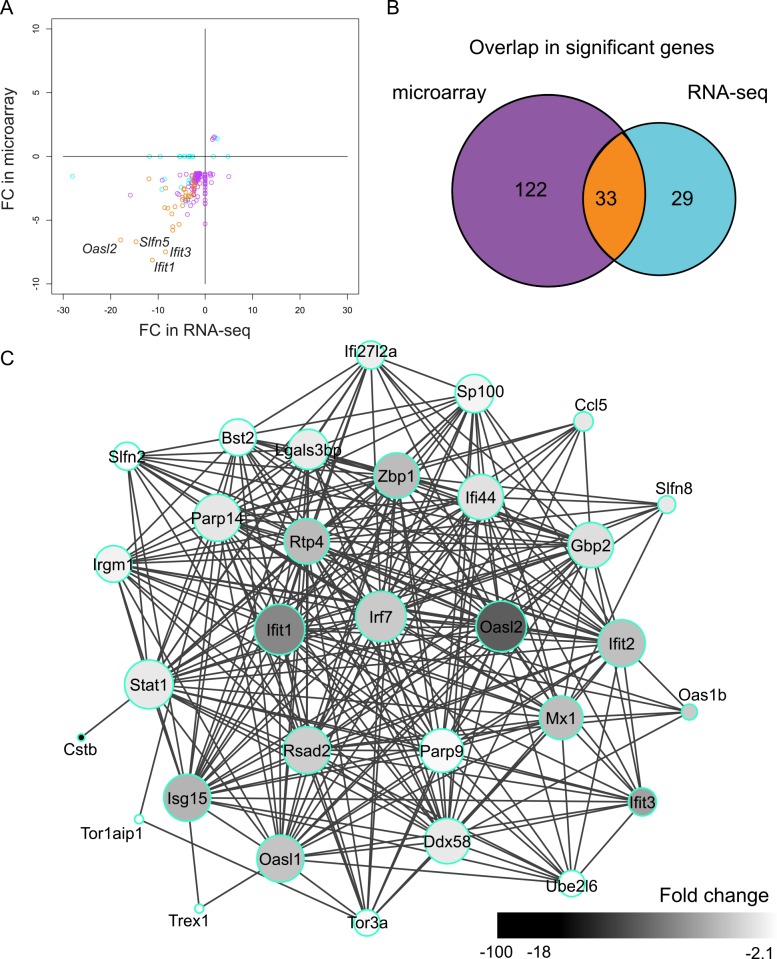
Fig 2. DEGs identified by microarray- and sequencing-based expression profiling of Cstb-/- microglia.
(A) Scatter plot of the FCs of the differentially expressed genes (DEGs) identified by microarray and RNA-seq. DEGs common to both methods are depicted in orange, RNA-seq-specific DEGs in light blue, and microarray-specific DEGs in purple. (B) Venn diagram showing the overlap in the number of DEGs. The colors correspond to the colors in A. (C) Protein-protein interaction network of the 33 genes differentially expressed in microarray and RNA-seq. The size of each node is proportional to the number of its connections to other nodes and the color of each node illustrates the fold change of the gene it represents.

