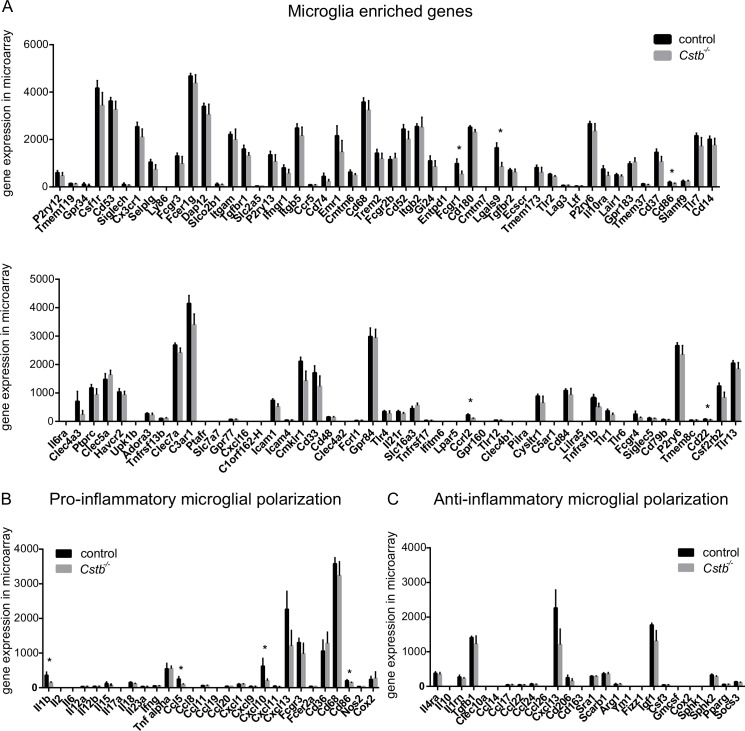
Fig 3. Microarray expression values of genes associated with microglia or microglial activation in control and Cstb-/- microglia.
Microarray gene expression level of transcripts (A) reportedly enriched in microglia, (B) associated with pro-inflammatory, and (C) with anti-inflammatory activation of microglia determined in control (black bars) and Cstb-/- (grey bars) microglia. The asterisk (*) marks genes significantly altered in Cstb-/- microglia compared to control microglia. Error bars represent standard deviation (SD).

