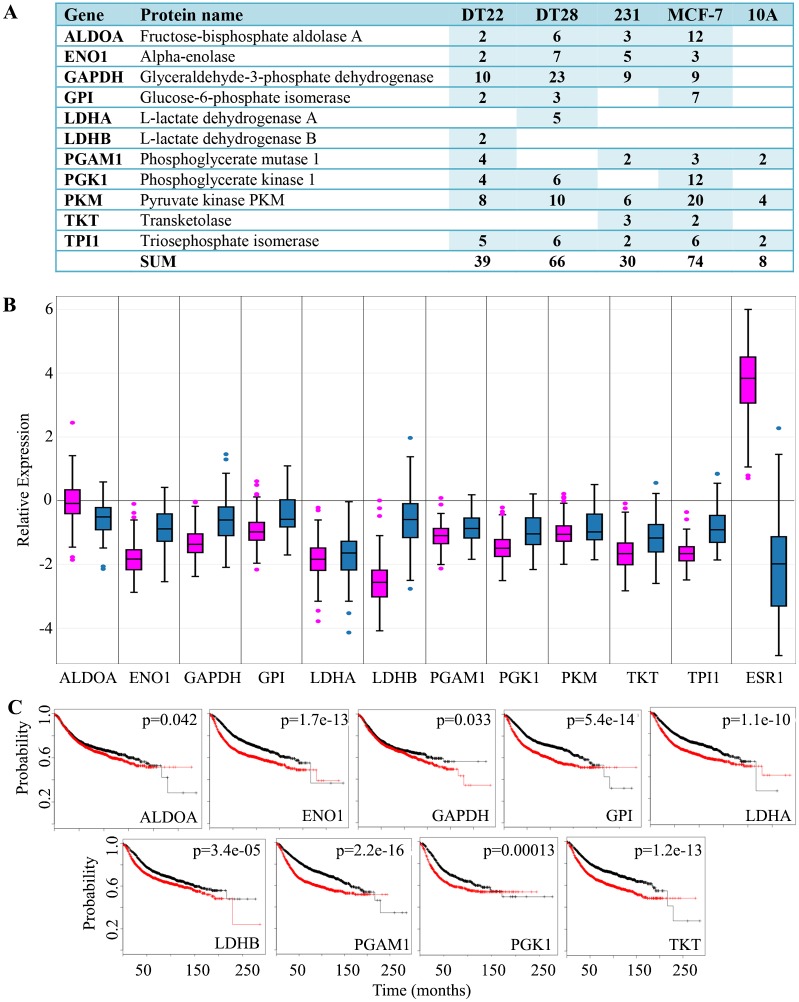
Fig 2. Glycolytic enzymes detected in the CM of BC and MCF-10A cells.
A. The number of SCs identified in the CM of each cell line is indicated. A blank cell indicates that no SCs were detected. Both the HUGO gene symbol and Uniprot recommended protein name are provided. MDA-MB-231 and MCF-10A cells are labeled as 231 and 10A, respectively. NSAF data can be found in S3 Table. B. BC gene expression data was extracted from TCGA and boxplots were created for luminal A (pink) and TNBC (blue) tumors. ERα (ESR1) was included for comparison. Expression values are log2 normalized, tumor matched normal, with normal mammary tissue expression set to 0. C. Kaplan-Meier survival curves for human BC patients were created for 9 of the glycolytic enzymes secreted by BC cells in 3D cultures. The x axis represents the months of recurrence-free survival. Red and black curves indicate higher and lower expression, respectively. The p-value for each result is shown in the upper right quadrant. (Abbreviations: CM = conditioned medium, BC = breast cancer, SC = spectral counts, TCGA = The Cancer Genome Atlas, TNBC = triple negative breast cancer, 3D = three dimensional)

