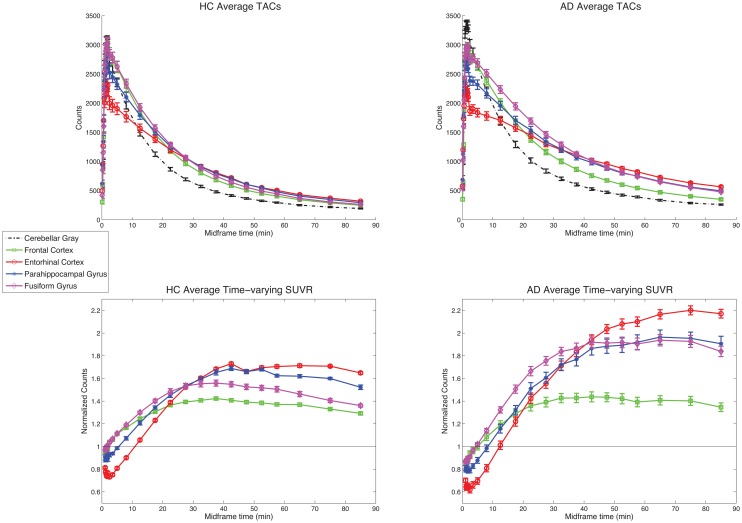
Fig 1. Time-activity curves and time-varying SUVRs.
Average time-activity curves (0–90 min) for HC (top left; n = 6) and AD (top right; n = 6) participants, for 5 select ROIs, and average time-varying SUVRs (1–90 min data shown for clarity) for HC (bottom left; n = 6) and AD (bottom right; n = 6) participants, for 4 select ROIs (values normalized to within-subject mean cerebellar gray). Error bars represent standard error of the mean. Data for n = 16 participants with 60 min of data are similar.

