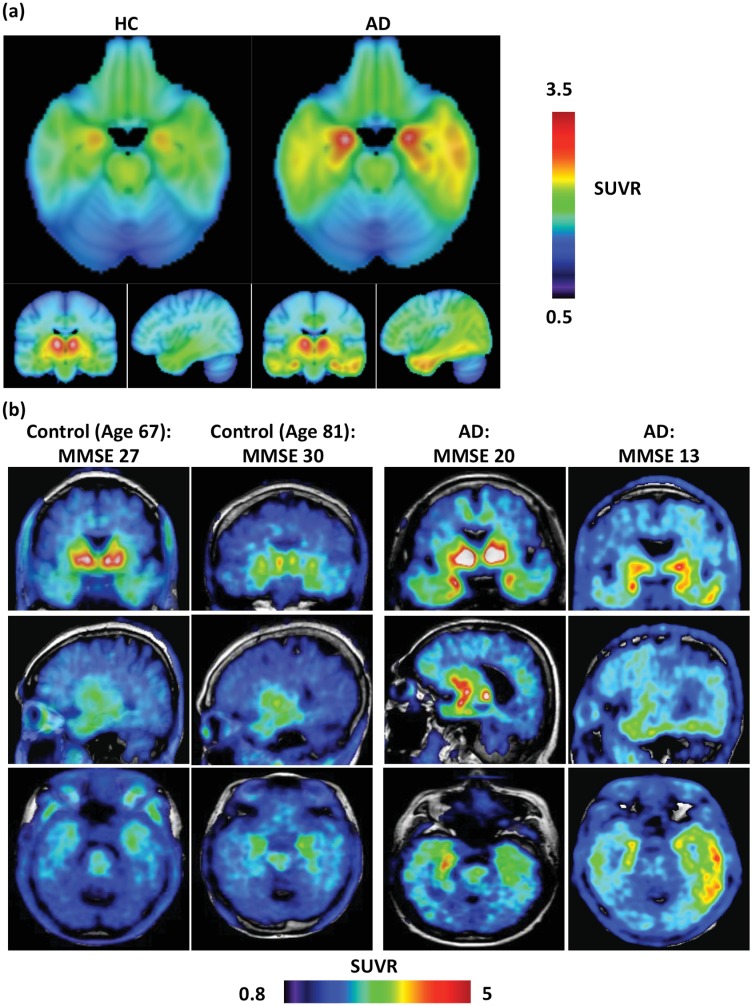
Fig 5. Average and representative THK5351 SUVR 40–60 min PET images overlaid on MRI images.
(a) Average images for 6 HC (L) and 10 AD (R) participants, using a cerebellar gray matter reference region. Neurological convention: right hemisphere on right. (b) Representative images of 4 participants. SUVR range differs between average and single-subject images to illustrate full dynamic range of SUVR binding across participants.

