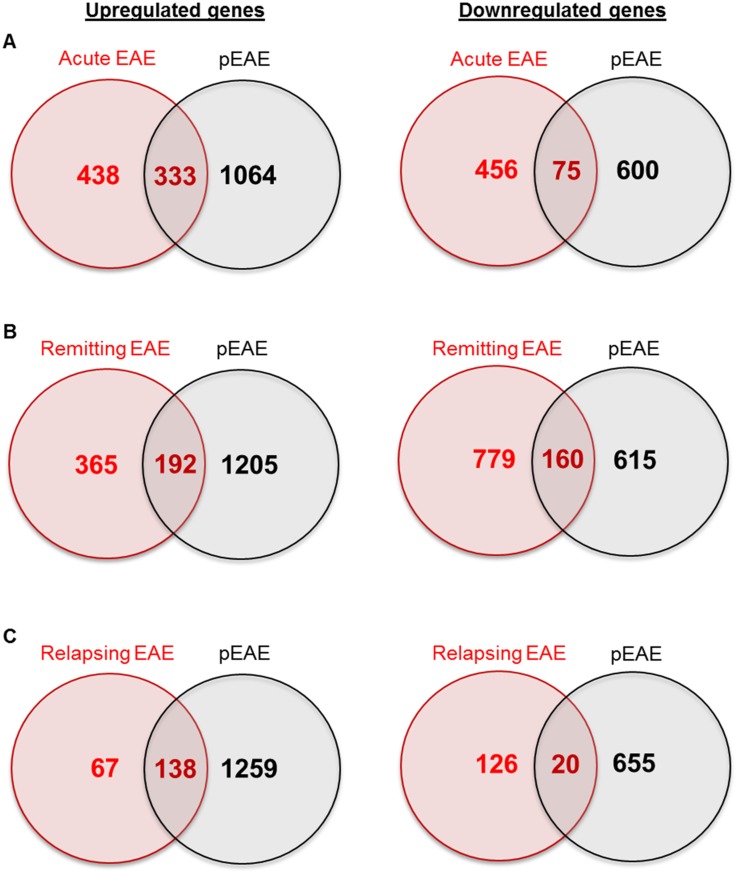
Fig 4. Comparison of the differentially expressed pEAE genes with differentially expressed genes in MOG-induced EAE in Dark Agouti rats at different disease stages.
(A) Venn diagrams of upregulated and downregulated pEAE genes compared with acute MOG-induced EAE. (B) Venn diagrams of upregulated and downregulated pEAE genes compared with remitting MOG-induced EAE. (C) Venn diagrams of upregulated and downregulated pEAE genes compared with relapsing MOG-induced EAE.

