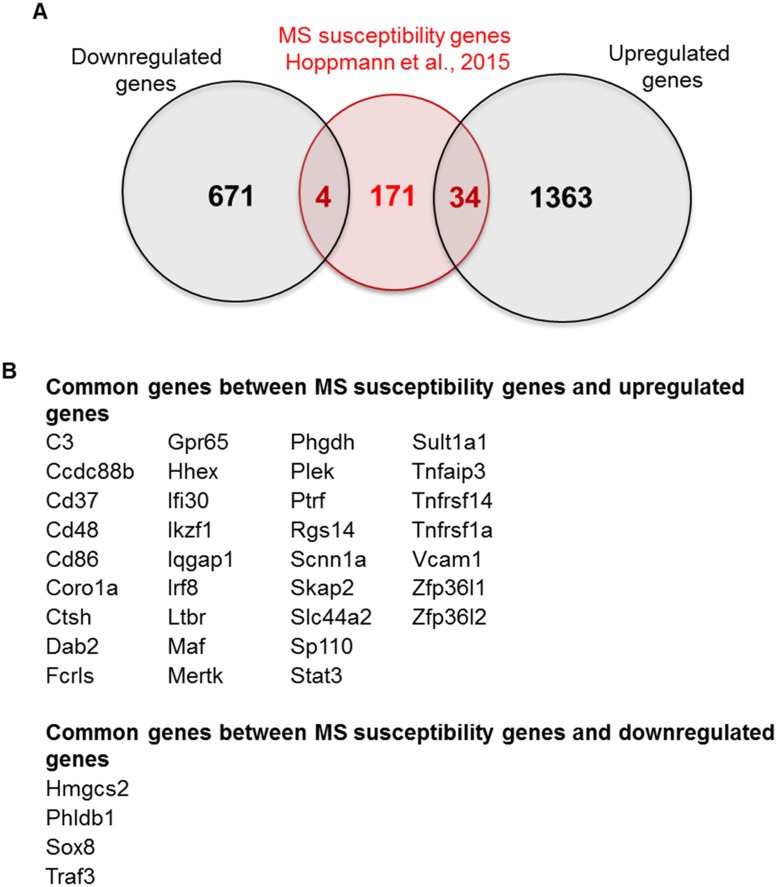
Fig 7. Comparison between the differentially upregulated and downregulated genes in the pEAE mice and MS susceptibility genes.
(A) Venn diagram depicting the common genes between MS susceptibility genes (Hoppmann et al., [74]) and upregulated EAE genes (34) and the common genes between the MS susceptibility genes and downregulated EAE genes (4). (B) List of the common genes as identified in the Venn diagram.

