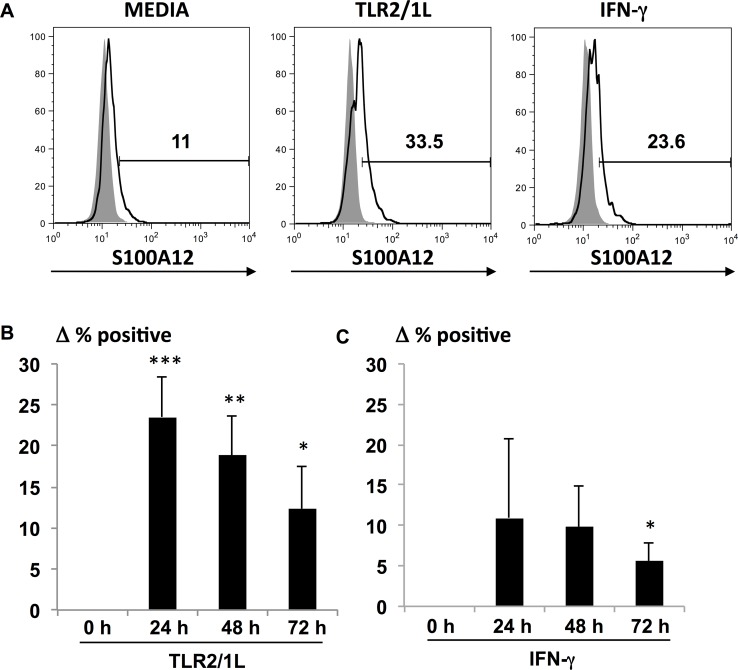
Fig 4. TLR2/1L and IFN-γ inducible S100A12 protein expression.
Intracellular S100A12 protein expression following stimulation of MDMs with TLR2/1L or IFN-γ for 24, 48, and 72 hours. (A) Representative histogram at 48 hours from flow cytometry showing percent of S100A12 positive cell population (white) with respect to isotype control (gray) in media, TLR2/1L and IFN-γ treated MDMs. Change in percent S100A12 positive cells in (B) TLR2/1L (n = 9) and (C) IFN-γ (n = 5) stimulated conditions compared to media control at each time point. Data are represented as mean ± SEM, *P ≤0.05, **P ≤0.01.

