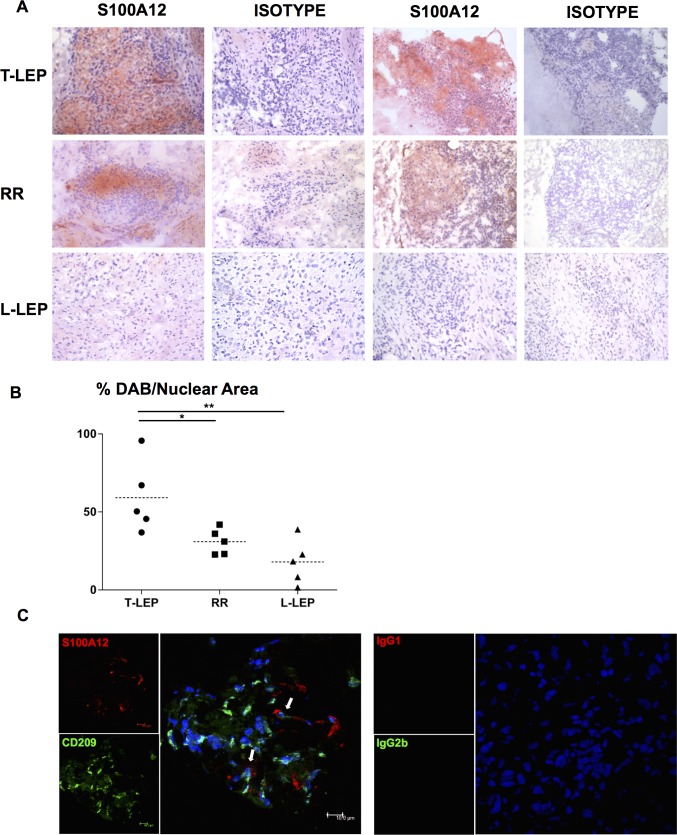
Fig 5. Expression of S100A12 in skin lesions from leprosy patients.
(A) S100A12 labeling of leprosy skin biopsy specimens by immunoperoxidase. Two representative images are shown for each condition: T-lep, RR, and L-lep, as well as an isotype control for each representative staining. Original magnification: x20. (B) The percentage of diaminobenzidine (DAB)-stained area per nuclear area was calculated for each photomicrograph using ImmunoRatio [30]. Each dot represents the %DAB-stained area/nuclear area for each individual photomicrograph. Horizontal dotted line represents mean %DAB per nuclear area for n = 5. One-Way ANOVA analysis was performed (P = 0.006) using GraphPad Prism software and post hoc analysis (Turkey test) is indicated by the asterisk (*P<0.05 and ** P<0.01). (C) Co-expression of S100A12 (red) and CD209 (green) in skin lesion from RR patient. Nucleus was stained with DAPI (blue). Arrows indicate areas of co-expression of S100A12 and CD209; scale bar = 10μm. Original magnification: x40.

