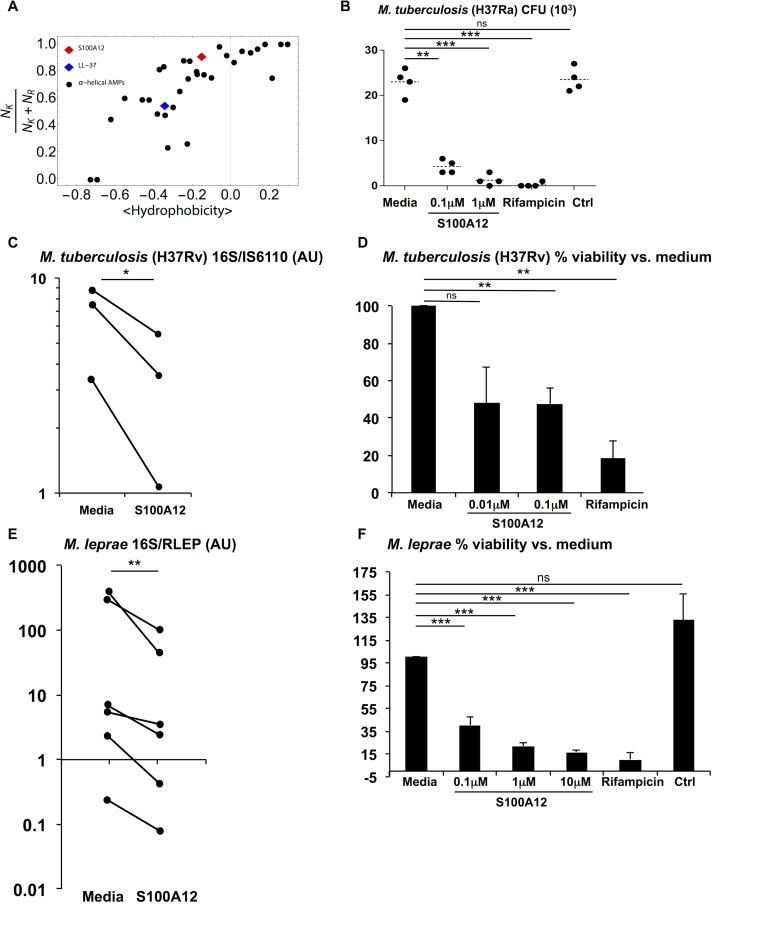
Fig 6. Antimicrobial activity of S100A12 against mycobacteria.
(A) A plot of (NK/(NK + NR)) vs. mean hydrophobicity for all known α-helical antimicrobial peptides in the antimicrobial peptide database (http://aps.unmc.edu/AP/main.php). The black circles represent peptides that meet amino acid criterion for membrane curvature generation and exhibit membrane permeating antimicrobial activity. NK and NR are numbers of lysines (K) and arginines (R) on the peptide or protein. Cathelicidin (LL-37) is represented by the blue diamond and S100A12 by the red diamond. (B) M. tuberculosis H37Ra was incubated in the presence of S100A12 protein at the indicated concentrations for 3 days (n = 4). Rifampicin was used as a positive control (20 mg/ml) and IFN-γ protein was used as a negative control. Bacteria were then quantified by CFU assay (n = 4). Each dot represents a replicate sample for each condition indicated (x-axis). (C) M. tuberculosis H37Rv was cultured in the presence of S100A12 protein (0.1μM) or media control for 3 days. Arbitrary units (AU) as determined by the ratio of RNA (16S) to DNA (IS6110) as a measure of viability are shown for H37Rv in media versus S100A12 (n = 3). (D) Data from B is represented in % viability relative to media control for in addition to rifampicin control (n = 3). (E) M. leprae was maintained in 7H9 media with S100A12. Shown in AU is the ratio of M. leprae RNA (16S) to DNA (RLEP) in media control versus S100A12 (0.1μM). Each dot represents a replicate sample for each condition, with a line connecting the AU of each replicate (n = 6). Since there is a large variation in absolute values and ratios, the P-value was determined based on log-transformed values, not log transformed ratios are shown here. (F) Data from D is represented as mean % viability, which was calculated with AU relative to media control. In addition, two other concentrations of S100A12 (1μM, n = 7 and 10μM, n = 3), positive control rifampicin (n = 9), and negative control protein (n = 7) are included. Data are represented as mean % viability ± SEM. *P ≤0.05, **P ≤0.01, ***P ≤0.001; ns, non-significant.

