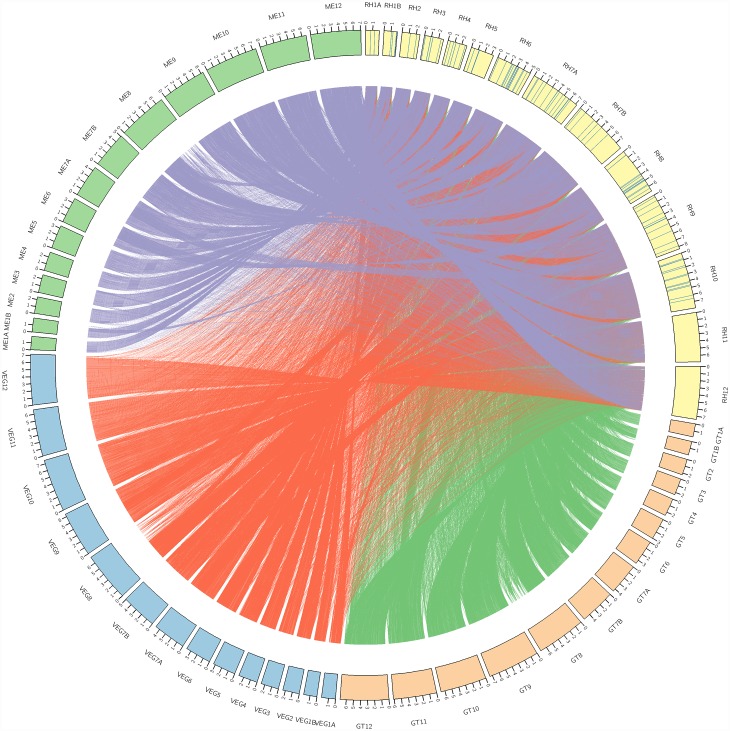
Fig 3. Circos plot illustrating the levels of synteny among genomes of different T. gondii strains.
Outer ring represents chromosomes of each strain, with the labelling of respective chromosome numbering. The scale marks on the chromosome represent 1Mb. The color bands represent syntenic blocks between the chromosomes under comparison with the chromosomes of T. gondii RH. The blue lines within the chromosome blocks of T. gondii RH indicate the T. gondii RH-unique genes identified as part of the orthologous gene study.

