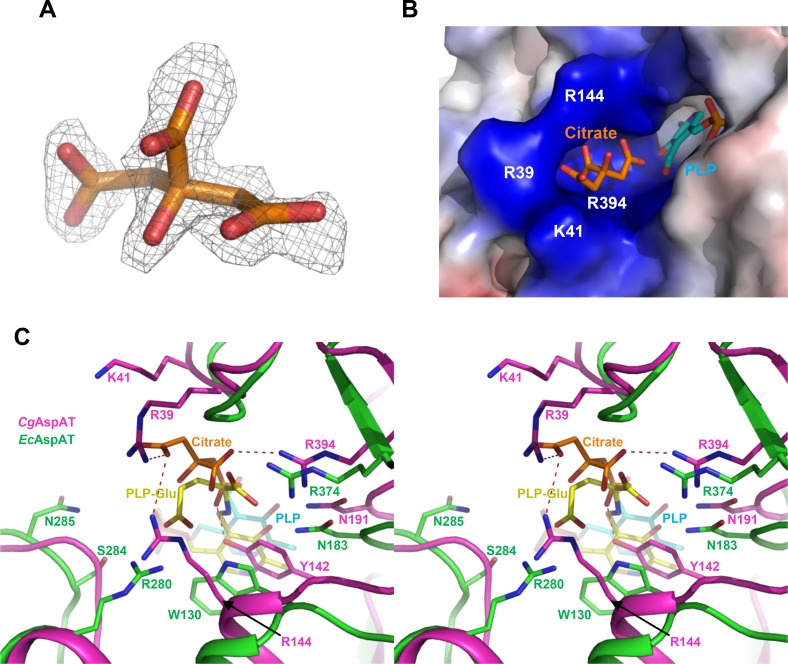
Fig 4. Substrate binding mode of CgAspAT.
(A) Electron density map of the bound citrate in CgAspAT. The electron density maps Fo-Fc of the bound citrate in CgAspAT is shown with a gray-colored mesh, and contoured at 2.5 σ (B) Electrostatic potential surface model of the substrate binding site. The CgAspAT structure is presented as an electrostatic potential surface model. The bound PLP and citrate are shown as stick models with cyan and orange colors, respectively. The highly positively-charged residues constituting the substrate binding site are labeled. (C) Stereo-view of substrate binding mode of CgAspAT. The CgAspAT structure is superposed with the EcAspAT structure in complex with PLP-glutamate. Structures of CgAspAT and EcAspAT are shown as cartoon diagram with magenta and green colors, respectively. Residues involved in the glutamate binding are shown as a stick model and labeled appropriately. The PLP-glutamate bound in EcAspAT is shown as a stick model with a yellow color, and the PLP molecule and the citrate ion bound in CgAspAT are with colors of cyan and orange, respectively.

