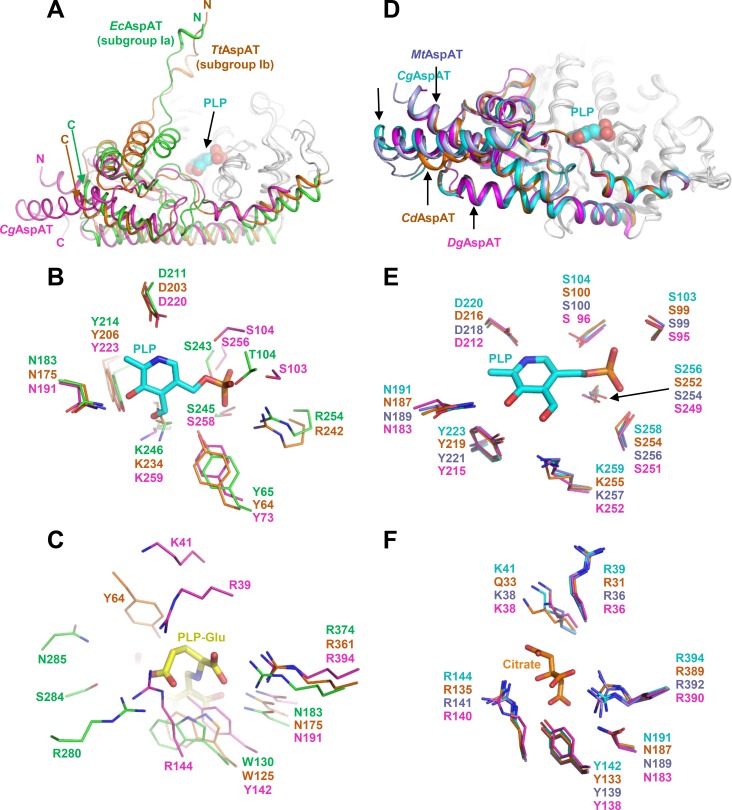
Fig 5. Comparison of CgAspAT with subgroup Ia and Ib.
(A) Comparison of the auxiliary domain of CgAspAT with those of AspATs from E. coli (EcAspAT, subgroup Ia) and T. thermophilus (TtAspAT, subgrpup Ib). Structures of EcAspAT, TtAspAT and CgAspAT are superimposed. The core domains of these enzymes are shown with a gray color, and the auxiliary domains of EcAspAT, TtAspAT and CgAspAT are distinguished with green, orange and magenta colors, respectively. The bound PLP and glutamate in CgAspAT are shown as sphere model with magenta and cyan colors, respectively. RMSD values for EcAspAT-TtAspAT, EcAspAT-CgAspAT, and TtAspAT-CgAspAT are 2.73, 3.39, and 2.93, respectively. EcAspAT, TtAspAT and CgAspAT are representative AspATs for subgroup Ia, Ib and Ic, respectively. (B) Comparison of the cofactor binding mode of EcAspAT, TtAspAT and CgAspAT. Structures of EcAspAT, TtAspAT and CgAspAT are superimposed. Residues involved in the PLP cofactor binding are shown as a stick model with green, orange and magenta colors for EcAspAT, TtAspAT and CgAspAT, respectively. The bound PLP in CgAspAT is shown as a stick model with a cyan color. (C) Comparison of the substrate binding mode of EcAspAT, TtAspAT and CgAspAT. Structures of EcAspAT, TtAspAT and CgAspAT are superimposed. Residues involved in the substrate binding are shown as a stick model with green, orange and magenta colors for EcAspAT, TtAspAT and CgAspAT, respectively. The bound PLP-glutamate in EcAspAT is shown as a stick model with a yellow color. (D) Comparison of the auxiliary domain of AspATs from subgroup Ic. Structures of CgAspAT, CdAspAT, MtAspAT and DgAspAT are superimposed. The core domains of these enzymes are shown with a gray color, and the auxiliary domains of CgAspAT, CdAspAT, MtAspAT and DgAspAT are distinguished with cyan, orange, light blue and magenta colors, respectively. The bound PLP and glutamate in CgAspAT are shown as stick models with magenta and cyan colors, respectively. RMSD values for CgAspAT-CdAspAT, CgAspAT-MtAspAT, CgAspAT-DgAspAT, CdAspAT-MtAspAT, CdAspAT-DgAspAT, and MtAspAT-DgAspAT are 0.65, 0.12, 1.33, 0.66, 1.38, and 1.35, respectively. (E) Comparison of the cofactor binding mode of AspATs from subgroup Ic. Structures of CgAspAT, CdAspAT, MtAspAT and DgAspAT are superimposed. Residues involved in the PLP cofactor binding are shown as a stick model with cyan, orange, light blue and magenta colors for CgAspAT, CdAspAT, MtAspAT and DgAspAT, respectively. The bound PLP in CgAspAT is shown as a stick model with a cyan color. (F) Comparison of the substrate binding mode of AspATs from subgroup Ic. Structures of CgAspAT, CdAspAT, MtAspAT and DgAspAT are superimposed. Residues involved in the substrate binding are shown as a stick model with cyan, orange, light blue and magenta colors for CgAspAT, CdAspAT, MtAspAT and DgAspAT, respectively. The bound citrate in CgAspAT is shown as a stick model with an orange color.

