
Fig 9. Model simulations of Vr kinetics in the absence and presence of blockers.
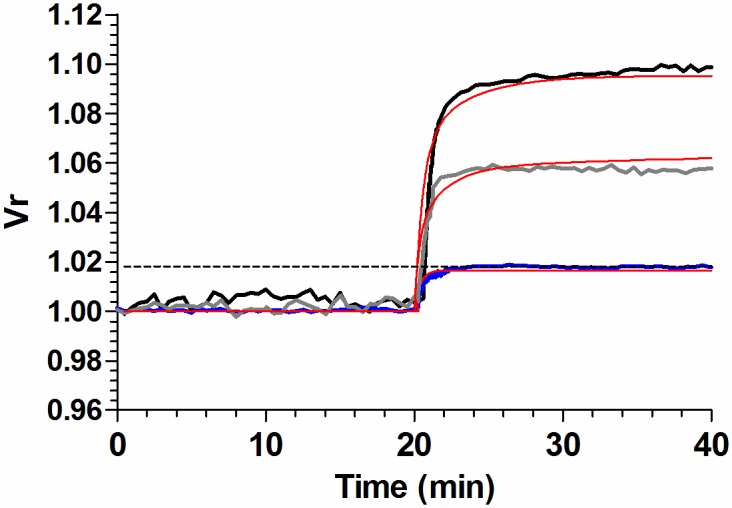
Model dependent fit to experimental Vr kinetics in the absence of blockers (control condition), and in the presence of 10 μM CBX or 10 μM NF110. Fitting was performed simultaneously to the three experimental conditions. MST7 was added at t = 20 min. Black, grey and blue lines correspond to experimental data of Figs 1A, 2A and 5A, respectively. Red lines show the best fitting curves to experimental data. The dashed line indicates the critical value of Vrc above which ATP release is triggered by swelling. Model for Vr kinetics is encoded in Eqs. A-B of S1 File, with values of best fit for the parameters given in Table A in S1 File.