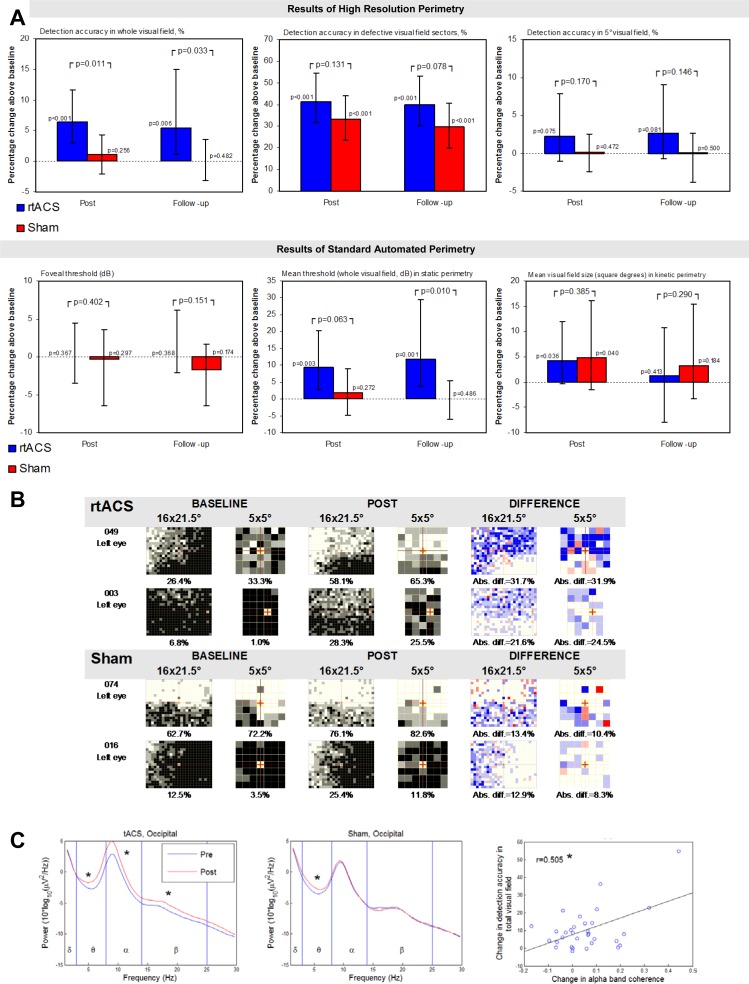
Fig 2. Perimetry measures and EEG.
(A) Primary and secondary analyses of VF outcome between- and within-groups after rtACS and sham-stimulation bar charts of primary (first upper graph) and secondary parameters of VF diagnostics measured using HRP and standard-automated static and kinetic perimetry. Results are given as medians and 95%-CI. Between-group comparisons were performed according to a pre-defined hypothesis using a one-sided U-test. Within-group BASELINE vs. POST and BASELINE vs. FOLLOW-UP comparisons were calculated separately for each treatment arm using Wilcoxon matched-pairs signed rank tests. The respective p-values are reported with p<0.05 considered as significant. (B) Individual change in HRP VF charts at BASELINE and POST in the two best responding patients of both groups. By superimposing HRP computer campimetric VF charts of three repeated measurements, VF areas were categorized as intact (perfect stimulus detection at a given location, white spots), partially damaged/relative defect (inconsistent stimulus detection, grey spots), and absolutely impaired areas (no stimulus detected, black spots). Detection increases and decreases after intervention are shown in blue and red, respectively. The percentage improvement of the detection accuracy was comparable between the whole HRP VF 16x21.5° and the central 5° VF. (C) Power spectra before and after the first stimulation session. Left sub-figure: One session of tACS increased power of theta (Z = 3.583, p<0.001), alpha (t = 4.571, p<0.001) and beta bands (Z = 3.142, p = 0.002) recorded from electrode positions above the visual cortex. Middle sub-figure: After sham stimulation a significant power increase was observed for only the theta band (Z = 3.147, p = 0.002). Right sub-figure: Scatter plot showing the relation between change in alpha band coherence at the occipital area of interest and change in detection accuracy in total visual field (primary outcome measure).

