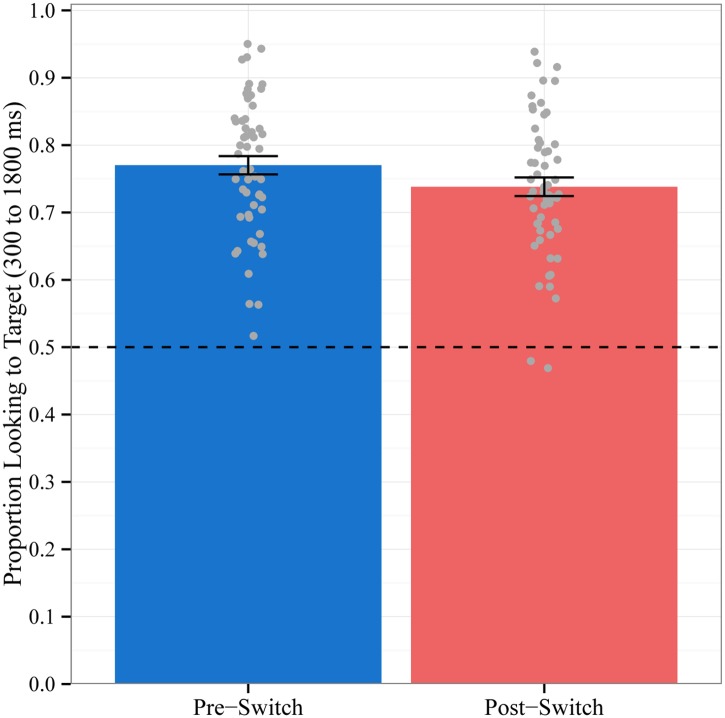
Fig 1. Mean Accuracy by Block.
Proportion of time spent looking to the target object out of the total time spent looking at both objects during the critical window for trials before the dimensional change (Pre-Switch) and after the dimensional change (Post-Switch). Chance = 0.5. Data points represent the proportion for each subject averaged across trials. Error bars represent +/- 1 SE.

