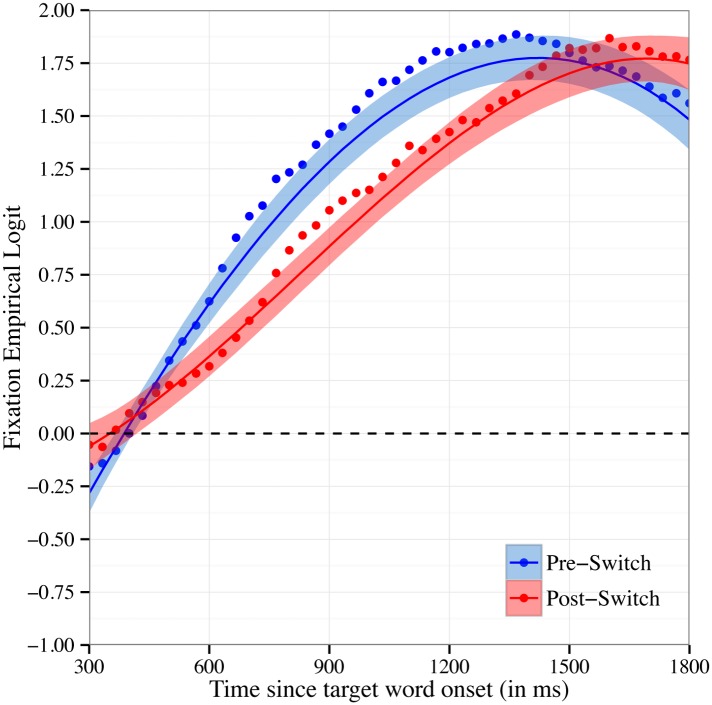
Fig 3. Time Course of Fixations by Block.
Time course of fixations to the target object on Pre-Switch and Post-Switch trials. Fixations are plotted as the empirical log-odds averaged across participants. Chance = 0 log-odds. Data points are observed behavioral data and lines the growth curve fits (ribbons around the lines indicate +/- 1 SE).

